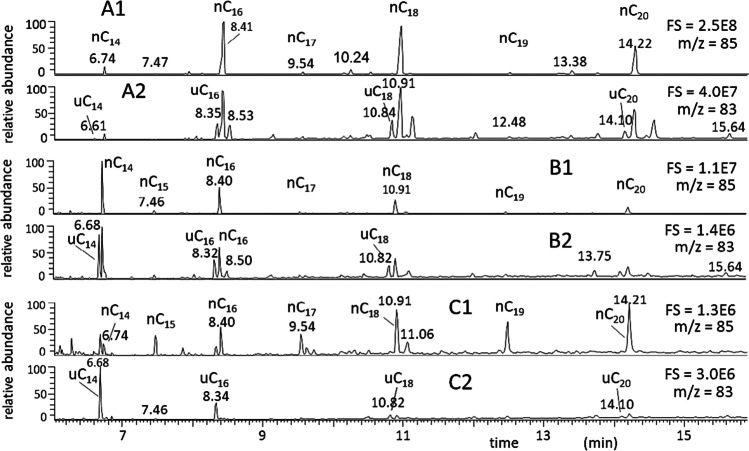
Fig. 3.
GC–MS chromatograms of airborne particulate extracts. A1 El Bey, Tunisia, m/z = 85 (n-alkanes); A2 El Bey, Tunisia, m/z = 83 (n-alkenes); B1 Tipaza, Algeria, m/z = 85 (n-alkanes); B2 Tipaza, Algeria, m/z = 83 (n-alkenes); C1 Reggio Calabria, Italy, m/z = 85 (n-alkanes); C2 Reggio Calabria, Italy, m/z = 83 (n-alkenes). [Personal communication. The samples were collected in the frame of a cooperative research project of our institute with Kasdi Merbah University of Ouargla, Dept. Mathematics and Sciences of Matter, Touggourt, Algeria, by applying the procedure described in Romagnoli P, Balducci C, Perilli M, Perreca E, Cecinato A (2016). Particulate PAHs and n-alkanes in the air over Southern and Eastern Mediterranean Sea. Chemosphere 159, 516-525. https://doi.org/10.1016/j.chemosphere.2016.06.024]

