FIGURE 1.

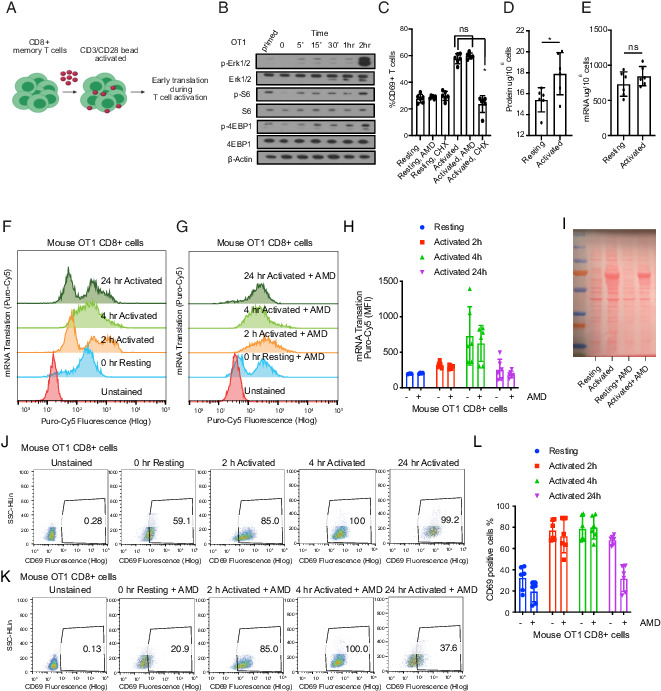
The early stages of T cell activation require translation and not transcription. (A) Schematic of OT-1 cell stimulation. CD8+ OT-1 T cells were primed ex vivo by an exposure to OVA-pulsed sublethally irradiated B cells, then placed to rest overnight and stimulated with CD3/CD28 beads. (B) Immunoblot of signal activation following bead stimulation to determine an early time point to measure translation activation. Similar results were obtained in three sets of experiments. (C) Flow cytometric quantification of T cell CD69 surface marker expression 2 h after activation with or without actinomycin D (AMD) (1 μM) or cycloheximide (CHX) (10 μg/ml) as indicated (n = 6). Individual data points and mean with SD are plotted. (D) Total protein and (E) total RNA content in 1 million OT-1 cells quantified by bicinchoninic acid (BCA) assay and a NanoDrop spectrophotometer, respectively. Data are representative of six experimental replicates. Individual data points and mean with SD are plotted. (F and G) Flow cytometry representative plot of two experiments showing incorporation of Cy5-conjugated puromycin (as mean fluorescence intensity [MFI]) in newly synthesized proteins in activated versus resting T cells, treated with AMD as indicated (data are representative of six biological replicates). Individual data points and mean with SD are plotted. (H) Quantification of flow cytometry data shown in (F) and (G). (I) Ponceau staining of the membrane containing protein lysates from 3 million OT-1 cells at indicated conditions. (J and K) Flow cytometry representative dot plot of two experiments showing CD69 positive staining in activated versus resting T cells, treated with actinomycin D as indicated. (L) Quantification of flow cytometry data shown in (J) and (K). CD69 staining was used (data are representative of six biological replicates). Individual data points and mean with SD are plotted. *p < 0.05.
