FIGURE 2.

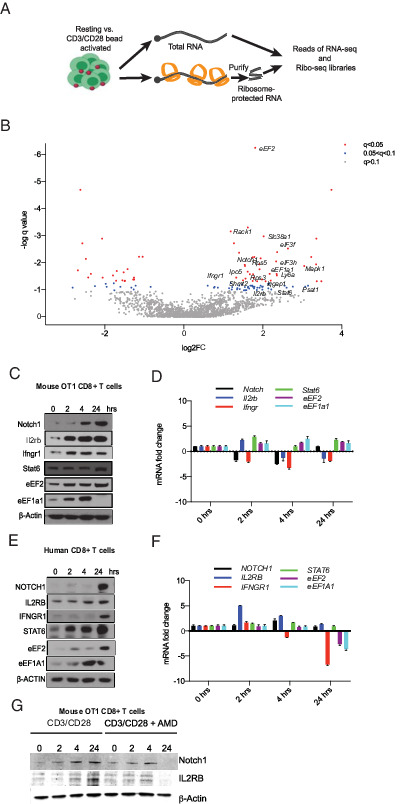
Rapid translational immune response program in CD8 T cells. (A) Schematic of ribosome footprinting study. We compared libraries of total mRNA (n = 3) against ribosome-protected (footprint) sequence reads (n = 3), which provided transcript-specific ribosome occupancy data as a surrogate of translation efficiency (TE). (B) Volcano plot of differential TE in resting and activated T cells, encompassing the q value and TE fold change. Blue dots indicate genes with 0.1 < q < 0.05, and red dots indicate genes with q < 0.05. (C) Western blot analysis of lysates from mouse OT-1 cells activated for the indicated time points. Similar results were obtained from three experiments. (D) mRNA expression levels of indicated genes in the same cells by real-time quantitative PCR (n = 3). (E) Western blot analysis of lysates from human CD8+ T cells activated for indicated time points. Representative blots from three experiments. (F) Corresponding mRNA expression levels (n = 3). (G) Western blot analysis of lysates from mouse OT-1 cells activated for indicated time points with and without actinomycin D (AMD). Similar results were obtained from three experiments.
