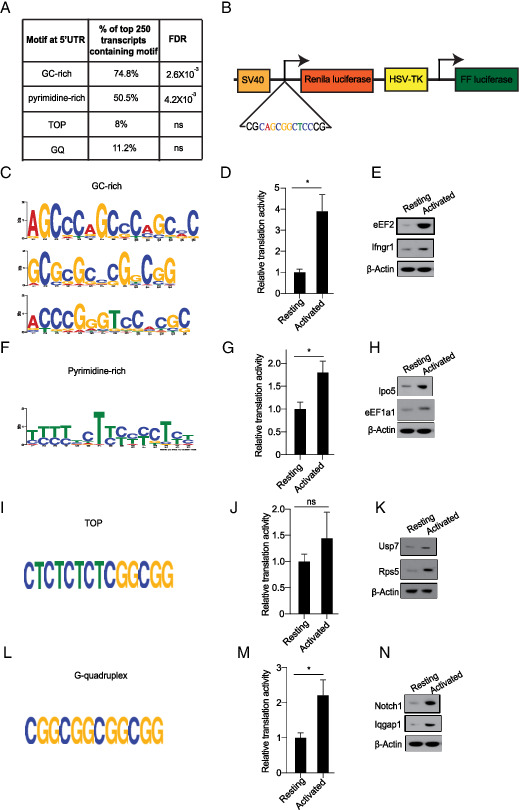
FIGURE 4.

Identification and experimental evaluation of 5′ UTR sequence elements that are overrepresented in the response signature. (A) Percent distribution of indicated sequence motifs in the top 250 genes with increased TE. (B) Graphic representation of a dual-luciferase reporter to test translational function of indicated 5′ UTR elements during OT-1 cell stimulation. (C) GC-rich motifs were identified through STREME analysis. (D) Reporter assay for GC-rich sequences in resting versus activated OT-1 cells. (E) Western blot analysis of indicated genes containing GC-rich motif. (F) Pyrimidine-rich motifs were identified through MEME analysis. (G) Relative translational activity of pyrimidine-rich motif in resting versus activated T cells, quantified as in (D). (H) Western blot analysis of indicated genes containing pyrimidine-rich motif. (I) Schematic representation of TOP motif. (J) The relative translational activity of TOP motif in resting versus activated T cells. (K) Western blot analysis of indicated genes containing TOP motif. (L) Schematic representation of G-quadruplex (GQ) motif. (M) Relative translational activity of GQ motif in resting versus activated T cells. (N) Western blot analysis of indicated genes containing GQ motif. All of the Western blot data are representative of three independent experiments. For all of the luciferase reporter assays, data are representative of three independent experiments. Mean with SD is plotted. *p < 0.05.
