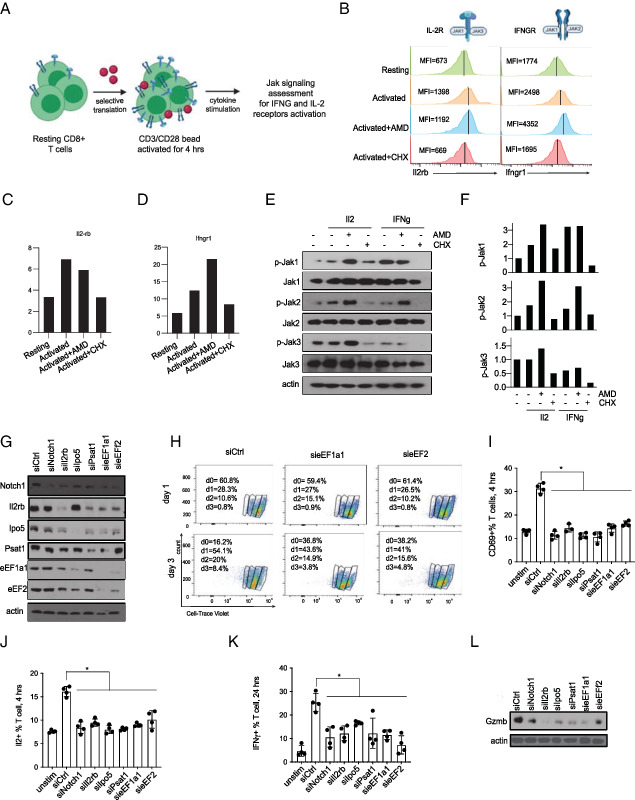
FIGURE 5.

The early translation of cytokine receptors augments subsequent signals and functional CD8 T cell activation. (A) Schematic representation of cytokine stimulation assay to determine the impact of early Il2rb and Ifngr1 translation on subsequent signaling activities. (B) Flow cytometry analysis of Il2rb and Ifngr1 expression (measured as mean fluorescence intensity [MFI]) on OT-1 cells activated for 4 h with or without actinomycin D (AMD) (1 μM) or cycloheximide (CHX) (10 μg/ml) as indicated. Representative histogram from three independent experiments. (C and D) Quantification of the MFI ratio of the Il2rb (C) and Ifngr1(D) receptor expression to unstained control (n = 3). (E) Western blot analysis of lysates from mouse T cell activated for 4 h with or without AMD (1 μM) or CHX (10 μg/ml) as indicated. Mouse recombinant Il2 or IFN-γ was added in the last 30 min before cell collection. (F) Quantification of immunoblot in (E). (G) siRNA-mediated knockdown of indicated proteins; representative blot from three independent experiments. (H) Proliferation of OT-1 cells treated with the indicated siRNAs measured by dilution of Cell Trace Violet stain. The proliferation was assessed by staining OT1 T cells with the fluorescent dye Cell Trace Violet (CTV) and determining the CTV content after 1 or 3 d of stimulation with CD3/CD28 beads. siRNA knockdown for eEF1A1 and eEF2 in T cells leads to reduced ability of T cells to proliferate as indicated with more cells in day 0 at 3 d postactivation. Data are representative of three experiments. (I) FACS analysis for CD69 as a marker of early T cell activation on OT-1 control cells compared with indicated siRNAs (n = 4); individual data points and mean with SD are plotted. (J) FACS analysis for intracellular Il2 as a marker of early T cell functionality in OT-1 control cells compared with indicated siRNAs (n = 4). Individual data points and mean with SD are plotted. (K) FACS analysis for intracellular IFN-γ as a marker of T cell functionality on OT-1 control cells compared with indicated siRNAs (n = 4). Individual data points and mean with SD are plotted. (L) Representatives immunoblot for granzyme B as a late indicator of T cell effector function in control and siRNA-treated cells. *p < 0.05.
