
Fig. 1 |. Characterization of the ADN and its in vitro validation.
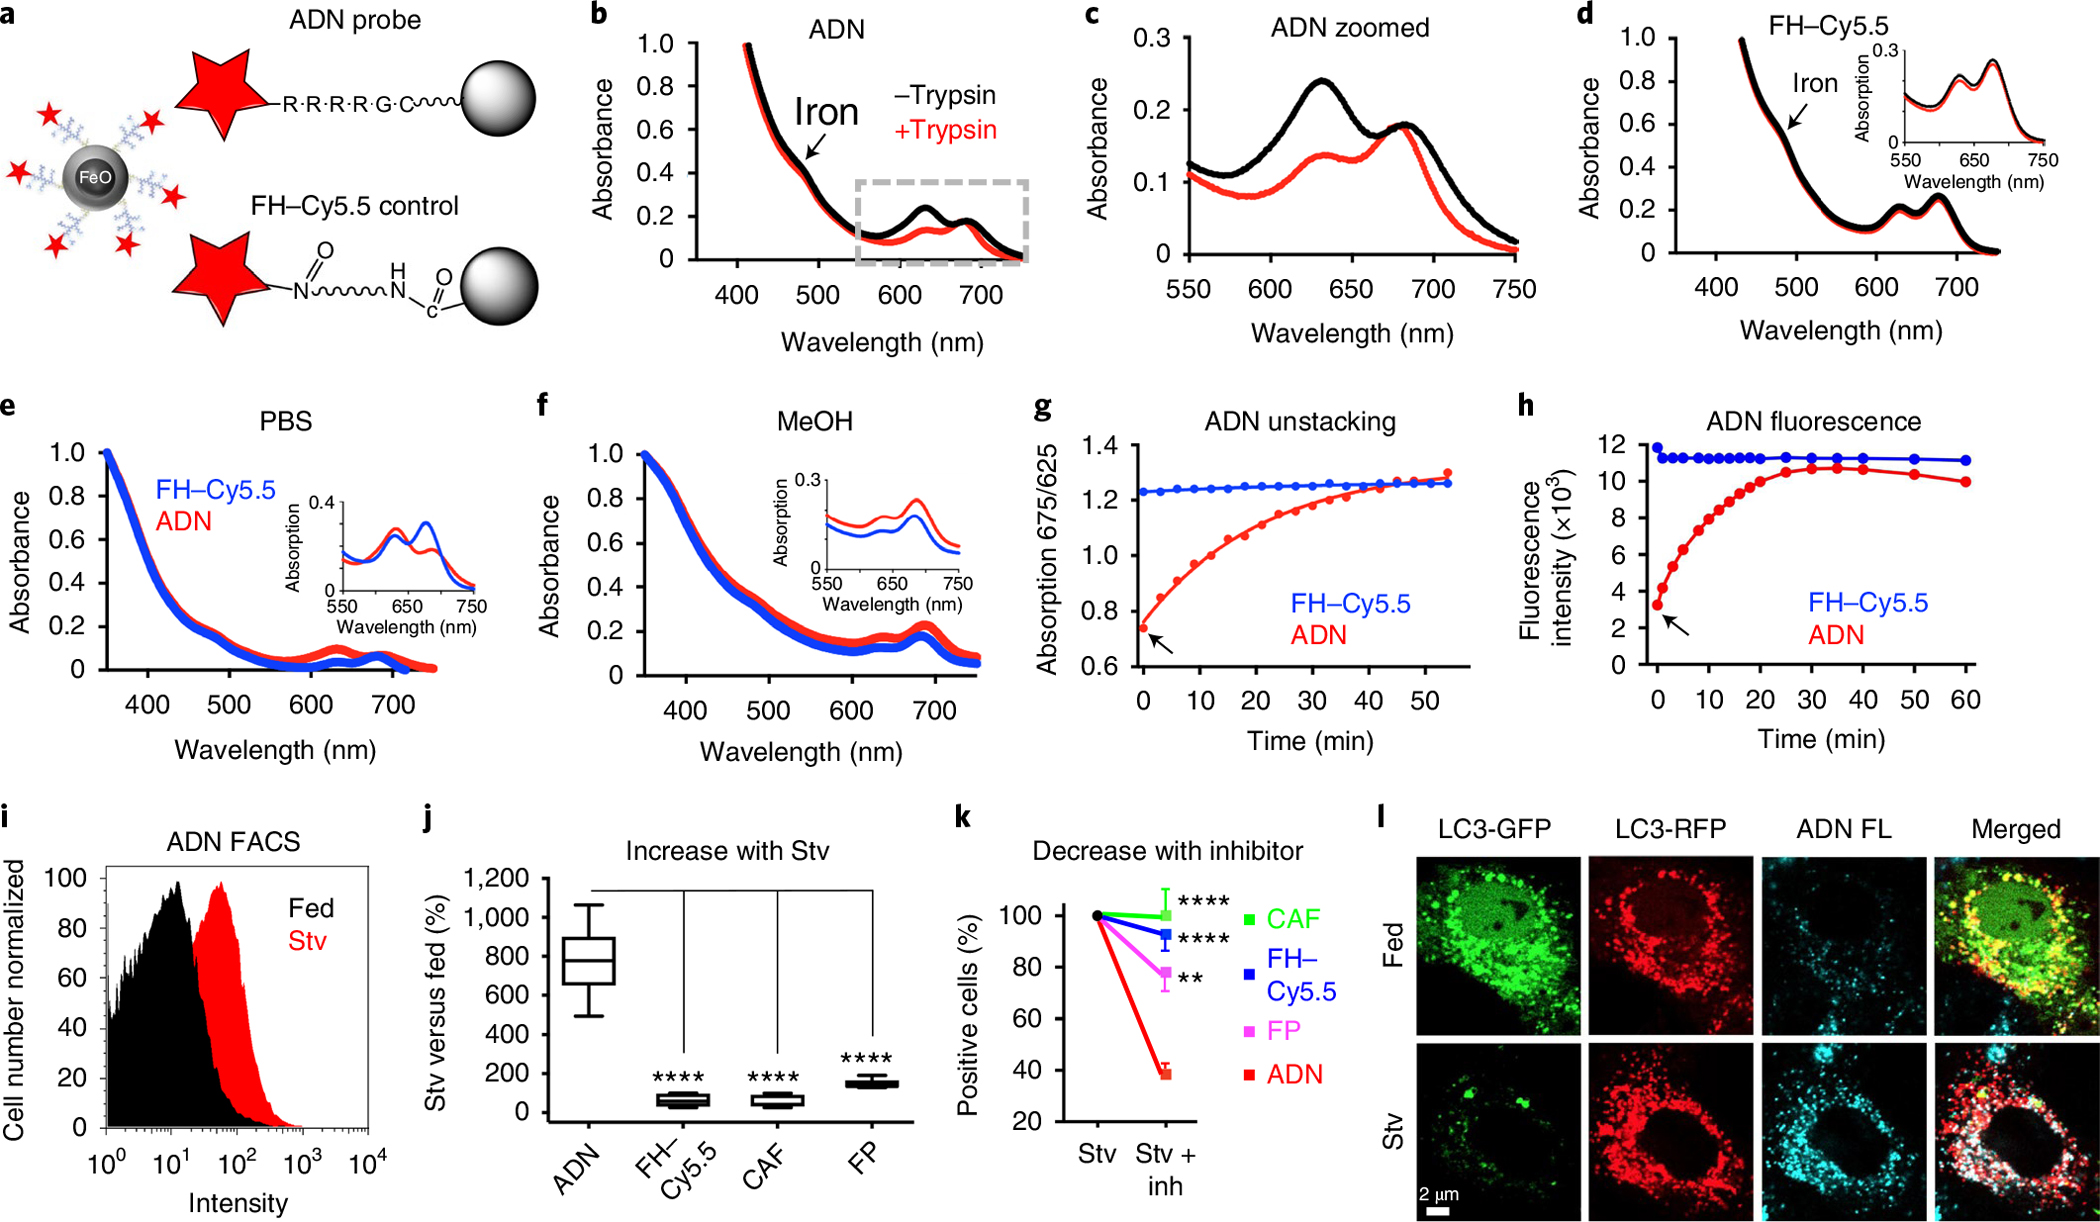
a, Schematic of ADN: the iron oxide NP ferumoxytol (FH) is decorated with cathepsin-cleavable polyarginine peptides, each conjugated to the NIR fluorochrome Cy5.5. For the control NP, Cy5.5 is conjugated directly to FH without an intervening peptide. b,c, Absorbance spectra of ADN showing a shift in the Cy5.5 peak (625 versus 675 nm) in its unactivated (black) and trypsin-activated (red) states, full spectrum (b) and zoomed in spectrum (c). d, No spectral shifts are seen with FH–Cy5.5. e,f, The absorbance spectra of unactivated ADN and FH–Cy5.5 differ in aqueous solution (e) but not in methanol (MeOH) (f). g,h, Time course of ADN activation following trypsin exposure (arrows) measured by the unstacking (spectral shift) of Cy5.5 and its signal intensity, respectively. i, FACS histogram showing ADN activation in starved (Stv) H9C2 cells. j, The increase in fluorescence in starved versus fed cells is significantly greater with ADN (n = 10) than other constructs: FH–Cy5.5 (n = 8), CAF (n = 6) and free fluorescent polyarginine peptide (FP; n = 7). In the plot, the box extends from the 25th to the 75th percentile, the line in the box indicates the median and the whiskers represent the minimum and maximum. k, Likewise, when the autophagy inhibitors E64d and pepstatin A are added to starved cells, the reduction in fluorescence (versus no inhibitors) is significantly greater with ADN (n = 7) compared with other constructs: FH–Cy5.5 (n = 7), CAF (n = 9) and FP (n = 7). Mean ± s.e.m. is plotted for Stv + Inh. For j and k, one-way ANOVA with Tukey’s post-test was performed. **P = 0.0017 and ****P < 0.0001. l, Confocal microscopy of H9C2 cells transfected with a dual GFP–RFP fluorescent LC3 plasmid (pTF-LC3). When autophagy flux is induced through starvation (Stv, bottom row), the LC3-GFP signal is lost owing to the low pH of the lysosome, while the LC3-RFP signal persists. ADN fluorescence (FL, blue) co-localizes with the red fluorescence from those autophagosomes that have undergone flux to the lysosome. The microscopy experiments were repeated in three biologically independent samples with consistent results. Scale bar, 2 μm.