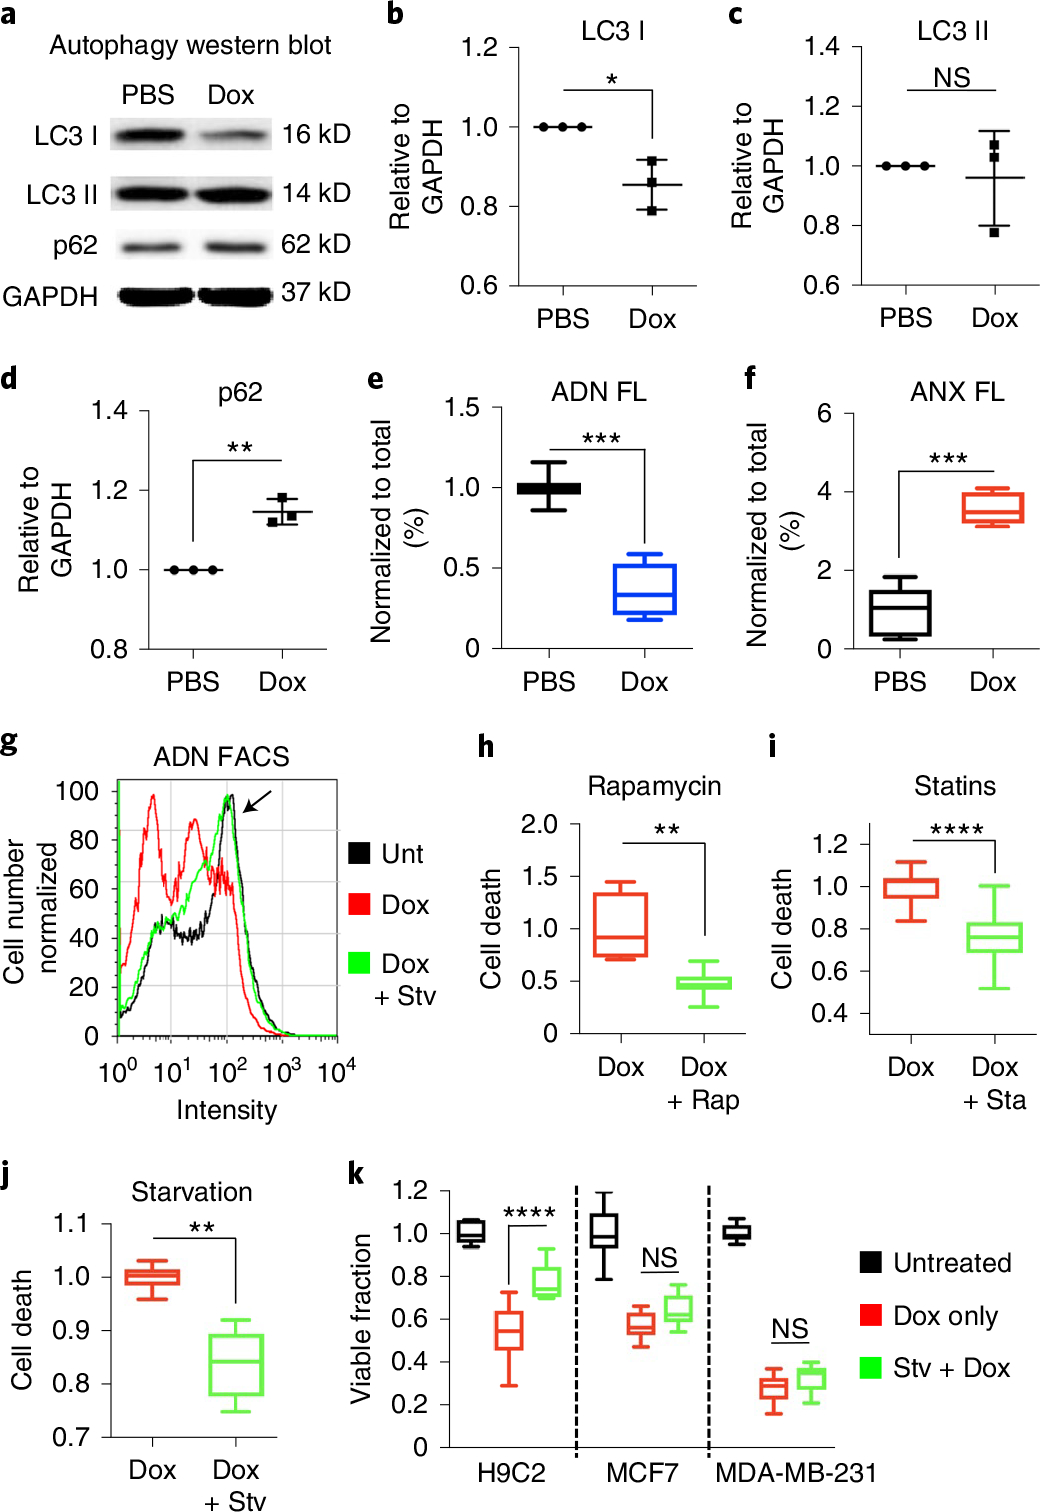
Fig. 4 |. ADN detects a reduction in autophagy when H9C2 cardiomyocytes are exposed to Dox and a cytoprotective effect when autophagy is restored.

a–e, Dox exposure inhibits autophagy in H9C2 cells: LC3 I is reduced (n = 3 in each PBS/Dox group, *P = 0.0162, two-tailed unpaired t-test), LC3 II is unchanged, p62 is increased (n = 3 in each PBS/Dox group, **P = 0.0014, two-tailed unpaired t-test) and ADN fluorescence is more than twofold decreased (n = 7 in PBS and n = 9 Dox groups, ***P = 0.0002, two-tailed Mann–Whitney test), consistent with a late block of autophagy flux. Uncropped gels are shown in Source Data Fig. 1. In b–d, mean ± s.d. is plotted; in e and f, box plots show minimum, maximum, median and 25–75% percentiles. f, A corresponding increase in cell death (ANX fluorescence) is seen (n = 6 in PBS and n = 9 in Dox groups, ***P = 0.0004, two-tailed Mann–Whitney test). g, Histogram of ADN fluorescence in H9C2 cells exposed to PBS, Dox alone and Dox plus nutrient deprivation/starvation. The peak in the histogram of the Dox + Stv cells is shifted back towards the ADN peak of untreated cells (arrow), consistent with a restoration of autophagy. h–j, The stimulation of autophagy by rapamycin (Dox n = 3 and Dox + Rap n = 9, **P = 0.0091, two-tailed Mann–Whitney test) (h), statins (Dox n = 12 and Dox + Sta n = 12, ****P = < 0.0001, two-tailed Mann–Whitney test) (i) and starvation (Dox n = 6, Dox + Stv n = 6, **P = 0.0022, two-tailed Mann–Whitney test) (j) all reduce cell death (annexin-positive fraction) in H9C2 cells exposed to Dox. Box plots show minimum, maximum, median and 25–75% percentiles. k, In H9C2 cells, starvation also increases cell survival/viability by methylthiazol tetrazolium (MTT) after Dox exposure. However, in common human cancer cell lines (MCF7 and MDA-MB-231), no attenuation in the cytotoxicity (loss of viability by MTT) of Dox is seen with the induction of autophagy through starvation. H9C2 n = 6, MCF7 n = 9 and MDA-MB-231 n = 12 for all conditions. One-way ANOVA with Tukey post-test was performed. ****P < 0.0001. Box plots show minimum, maximum, median and 25–75% percentiles.
