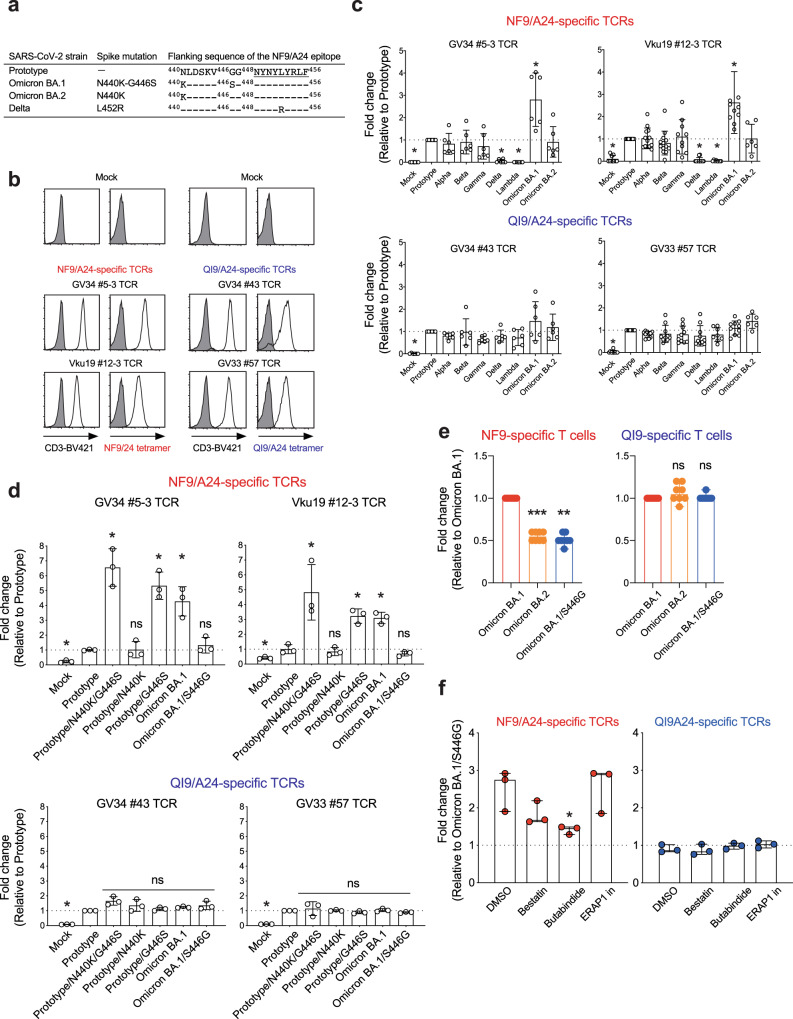
Fig. 3. Identification of mutation associated with increased TCR sensitivity.
a Spike-derived HLA-A24-restricted NF9 epitopes and the N-terminal flanking region from the variant. b–d TCR-peptide/HLA interaction on a TCR-transduced Jurkat NFAT-luciferase reporter cell. b Jurkat cells alone (shaded histogram) or those expressing NF9/A24-specific TCRs (#5-3 and #12-3) or QI9/A24-specific TCRs (#43 and #57) (open histogram) were stained with anti-CD3 mAb and their cognate HLA-A24 tetramers and then analyzed by flow cytometry. c, d The level of peptide/HLA complexes was evaluated by NFAT-luciferase reporter activity of TCR-transduced Jurkat cells. Data of NF9/A24-specific TCRs and QI9/A24-specific TCRs are shown. Fold changes of reporter activity by NF9/A24- and QI9/A24-specific TCRs compared to the target cells expressing prototype spike protein are shown. e Fold changes of IFN-γ by NF9-specific T cells (left) and QI9-specific T cells (right) compared to the target cells expressing Omicron BA.1 spike protein in eight vaccinated donors (GV15, 26, 31, 33, 34, 36, 60, and 61) are shown. The assay was performed in triplicate, and data are expressed as median. A statistically significant difference versus Omicron BA.1 spike was determined by a two-tailed Mann–Whitney test. p = 0.0002 (***p < 0.001), and p = 0.0078 (**p < 0.01) versus Omicron BA.2 and Omicron BA.1/S446G, respectively. ns, no statistical significance. f The level of peptide/HLA complexes is evaluated following treatment with inhibitors, bestatin (120 μM), butabindide (150 μM), and ERAP1 inhibitor (50 μM). The effect of inhibitors was evaluated as reporter activity and shown by fold change of the level of peptide/HLA on target cells expressing Omicron BA.1 reversion S446G spike protein. Data are expressed as a median. Statistical analysis versus DMSO alone was determined by one-way ANOVA with multiple comparisons by Bonferroni correction. p = 0.0456 (*p < 0.05) versus butabindide. c A statistically significant difference versus prototype was determined by an unpaired two-tailed Student’s t test (*p < 0.05) and p values are shown as the followings: Mock (p < 0.0001), Delta (p < 0.0001), and Lambda (p < 0.0001) in NF9-specific TCRs and Omicron BA.1 in GV34 #5-3 TCR (p = 0.0043) and Vku #12-3 TCR (p = 0.003), and Mock (p < 0.0001) in QI9-specific TCRs (GV34 #43 and GV33 #57 TCR). ns, no statistical significance. Data are expressed as mean ± SD. d A statistically significant difference versus prototype was determined by an unpaired two-tailed Student’s t test (*p < 0.05) and p values are shown as the followings: Mock (p = 0.0001), Prototype/N440K/G446S (p = 0.0016), Prototype/G446S (p = 0.0012) and Omicron BA.1 (0.0046) in GV34 #5-3 TCR and Mock (p = 0.0321), Prototype/N440K/G446S (p = 0.0274), Prototype/G446S (p = 0.0025) and Omicron BA.1 (p = 0.0017) in Vku19 #12-3 TCR, and Mock (p < 0.0001) in QI9-specific TCRs (GV34 #43 and GV33 #57 TCR). ns, no statistical significance. Data are expressed as mean ± SD. c, d, f The assay was performed in triplicate or quadruplicate, and data are representative of two or three independent experiments. Source data are provided as a Source Data file.

