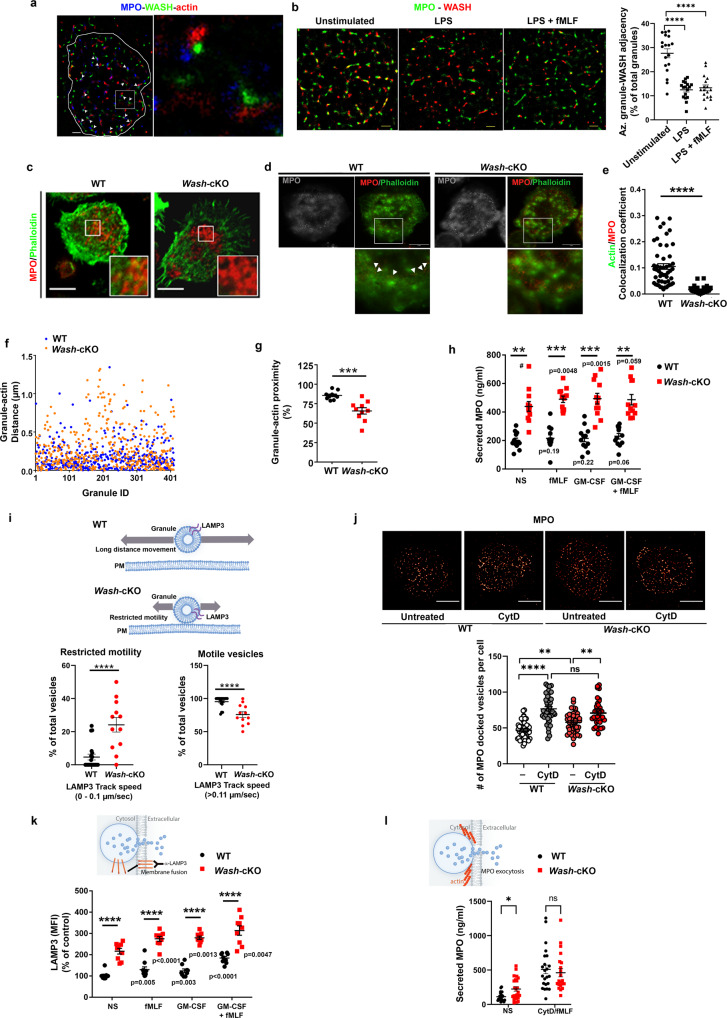
Fig. 2. WASH is necessary for azurophilic granule entrapment in polymerized actin and its deficiency unlocks exocytosis of this granule subtype.
a Super-resolution microscopy analysis (STORM) of the tripartite complex, WASH (green), F-actin (phalloidin, red), and azurophilic granules, (myeloperoxidase, MPO, blue) in wild-type (WT) neutrophils. Scale bar: 1 µm. Representative of two independent experiments. b Association of WASH with azurophilic granules in wild-type neutrophils. Left, STORM images. WASH (red), MPO (green). Scale bar: 1 µm. Right, Quantification of the proximity of WASH to the azurophilic granule marker under unstimulated (n = 18), primed (lipopolysaccharide, LPS) (n = 17) or stimulated (LPS + fMLF) (n = 17) conditions. Mean ± SEM of % of total granules adjacent (200 nm) to WASH molecular clusters per cell. Each symbol represents one cell. ****p < 0.0001. One-way ANOVA, Tukey’s multiple comparisons test. c Analysis of F-actin (green) and azurophilic granule (MPO, red) near the plasma membrane of WT and Wash-cKO (Washc1Δhaemo) neutrophils by confocal microscopy. Scale bar: 5 µm. n = 3, representative of the data quantified in e. d Super-resolution STED microscopy analysis of granule-actin network. Left, granules, shown in grey scale. Right, Arrowheads, azurophilic granule (MPO, red) entrapped in F-actin (phalloidin, green). Scale bar: 5 µm. Representative of 15 WT and 16 Wash-cKO neutrophils from 2 independent mice. e Quantification of F-actin distribution at the granule surrounding areas from confocal microscopy analysis shown in c. Mean ± SEM. ****p < 0.0001. Two-tailed unpaired Student’s t-test. n = 51 WT and 32 Wash-cKO cells from 3 independent mice. f Spot to Surface Distance analysis between granules and their most proximal actin fiber puncta. WT, 10 neutrophils (439 granules), Wash-cKO, 10 neutrophils (440 granules). g Percentage of azurophilic granules in each cell with actin puncta at <300 nm. Mean ± SEM. ***p = 0.0002, two-tailed unpaired Student’s t-test. n = 10. h Azurophilic granule exocytosis measured as secreted MPO. NS, non-stimulated. Mean ± SEM. WT vs Wash-cKO: NS **p = 0.0027; fMLF ***p = 0.0005; GM-CSF ***p = 0.0007; GM-CSF + fMLF **, 0.0039; Kruskal-Wallis ANOVA multiple comparisons. n = 12 independent mice. The p values in the figure correspond to stimulated conditions compared to their unstimulated controls (paired Student’s t-test, one-tailed). #, outlier (Grubb’s test). i Analysis of vesicular dynamics of neutrophil granules expressing EGFP-LAMP3, at the exocytosis active zone using TIRFM (Scheme). Vesicles were binned in two groups: restricted motility (docked, 0.1 μm/s) and high motility (>0.11 μm/s), and plotted as a percentage of total vesicles in each group for a given cell. Mean ± SEM from 20 WT cells and 12 Wash-cKO cells from two independent experiments. ****p < 0.0001. Two-tailed, unpaired t-test. j Docking of azurophilic granules in the exocytic active zone by TIRFM and Super-Resolution Radial Fluctuations (SRRF). Each symbol represents a cell. ns, not significant; Mean ± SEM. WT vs Wash-cKO, **p = 0.0085; Wash-cKO, untreated (–) vs cytochalasin D (CytD), **p = 0.0019; ****p < 0,0001 (one-way ANOVA, Tukey’s multiple comparisons test). n = 48, 42, 44 and 36 cells from three independent mice analyzed for each condition. Scale bar: 5 µm. k Analysis of granule fusion (LAMP3 translocation to the plasma membrane). n = 9 independent mice from 3 independent experiments. Mean ± SEM. ****p < 0.0001 (one-way ANOVA, Tukey’s multiple comparisons test). In figure p values: stimulated conditions compared to their unstimulated controls (one-tailed paired Student’s t-test). l MPO secretion after treatment with CytD and the indicated stimuli analyzed by ELISA. Mean ± SEM. *p = 0.0279; ns, not significant, Kruskal-Wallis ANOVA multiple comparisons uncorrected Dunn’s test; NS, not stimulated. Each symbol corresponds to an independent mouse (n = 23 wild-type and 24 Wash-cKO mice) from 3 independent experiments. ns, not significant. Source data are provided as a Source Data file.

