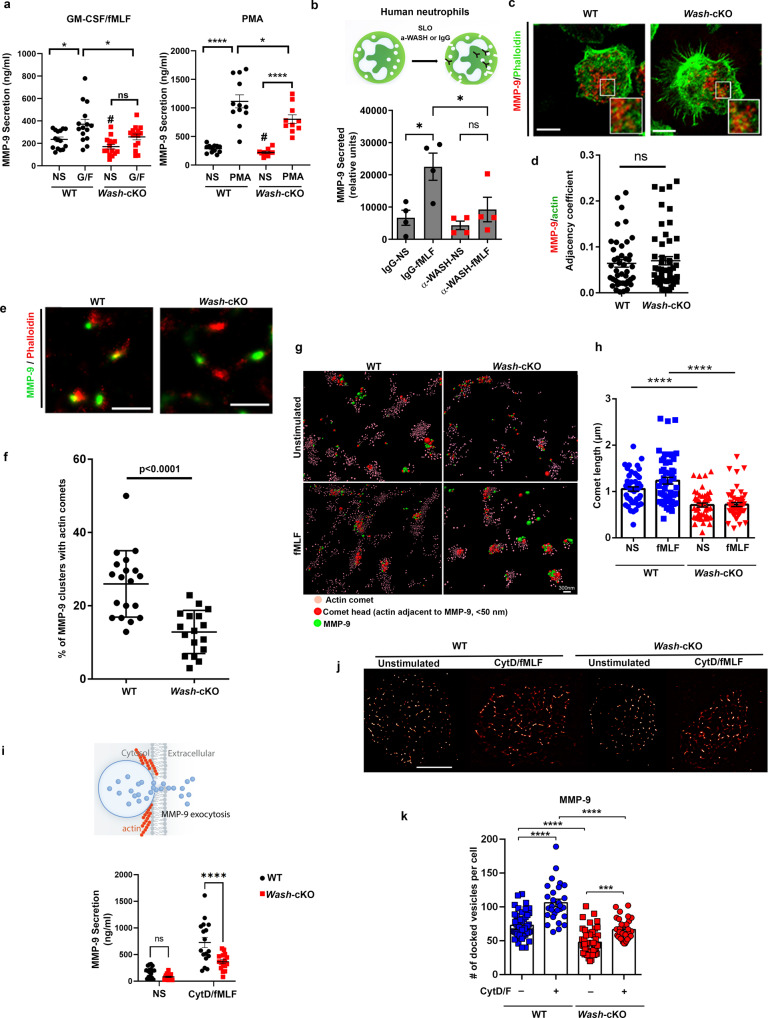
Fig. 4. WASH forms actin comets polarized at gelatinase granules and Wash-deficiency impairs exocytosis of this granule subtype.
a Gelatinase granule (MMP-9) exocytosis. Mean ± SEM. Left panel, n = 15 independent WT and Wash-cKO mice; Right panel, 12 WT, and 10 Wash-cKO independent mice analyzed in 4 independent experiments. Left panel, G/F (GM-CSF/formyl-Met-Leu-Phe). WT non stimulated (NS) vs G/F: *p = 0.01; WT vs Wash-cKO (G/F): *p = 0.042. ns, not significant. Right panel, WT vs Wash-cKO (PMA): *p = 0.0217; ****p < 0.0001. #, not significant vs WT unstimulated. b Gelatinase granule exocytosis in human neutrophils permeabilized with streptolysin-O (SLO) in the presence of anti-WASH inhibitory antibodies or IgG control. Mean ± SEM. *p = 0.0176 (IgG-NS vs. IgG-fMLF) and *p = 0.0481 (IgG-fMLF vs. α-WASH-fMLF). n = 4 healthy donors. c Distribution of F-actin (Phalloidin, green) and gelatinase granules (MMP-9, red) in proximity to the plasma membrane of wild-type (WT) and Wash-cKO (Washc1Δhaemo) neutrophils, analyzed as in Fig. 2c. Scale bar: 5 µm. Representative of 3 experiments. d Quantitative analysis of granule-actin adjacency, which detects the contiguous overlapping margins between granules and F-actin. n = 44 WT and 52 Wash-cKO cells. Mean ± SEM. ns, not significant. Two-tailed unpaired t-test. e Super-resolution STORM microscopy analysis of F-actin (phalloidin, red) comets in association with MMP-9-granule molecular clusters (green) in unstimulated wild-type and Wash-cKO neutrophils. Scale bar: 1 µm. n = 3 experiments. f Quantitative analysis of the number of MMP-9 clusters associated with actin comets from 19 WT and 17 Wash-cKO cells from 2 independent experiments. Mean ± SD. Two-tailed unpaired t-test. g Representation of comets by localization coordinates for single molecule actin clusters reconstructed according to their polarization and size. Representative of the data quantified in h. Scale bar: 300 nm. h Quantification of comet length. Each symbol represents one comet from 5 independent cells either not stimulated (NS) or stimulated with fMLF. A total of 50 comets per condition were analyzed. Mean ± SEM. ****p < 0.0001. i Effect of cytochalasin D treatment on gelatinase granules exocytosis. Upper panel, Representative scheme. Lower panel, Secreted MMP-9 was analyzed by ELISA. NS, not stimulated, CytD/F, cytochalasin D + fMLF. n = 17 WT and 16 Wash-cKO mice. Mean ± SEM. ****p < 0.0001. Four independent experiments. j, k Analysis and quantification of the distribution of gelatinase granules in the exocytic active zone by TIRFM and SRRF. Scale bar = 5 µm. Each symbol represents a cell treated with cytochalasin D/fMLF or vehicle. Mean ± SEM. ***p = 0.0005; ****p < 0,0001. A total of 28 to 48 cells per group were analyzed. a, b, h, i and k, one-way ANOVA multiple comparisons test (Tukey’s). ns, not significant. Source data are provided as a Source Data file.

