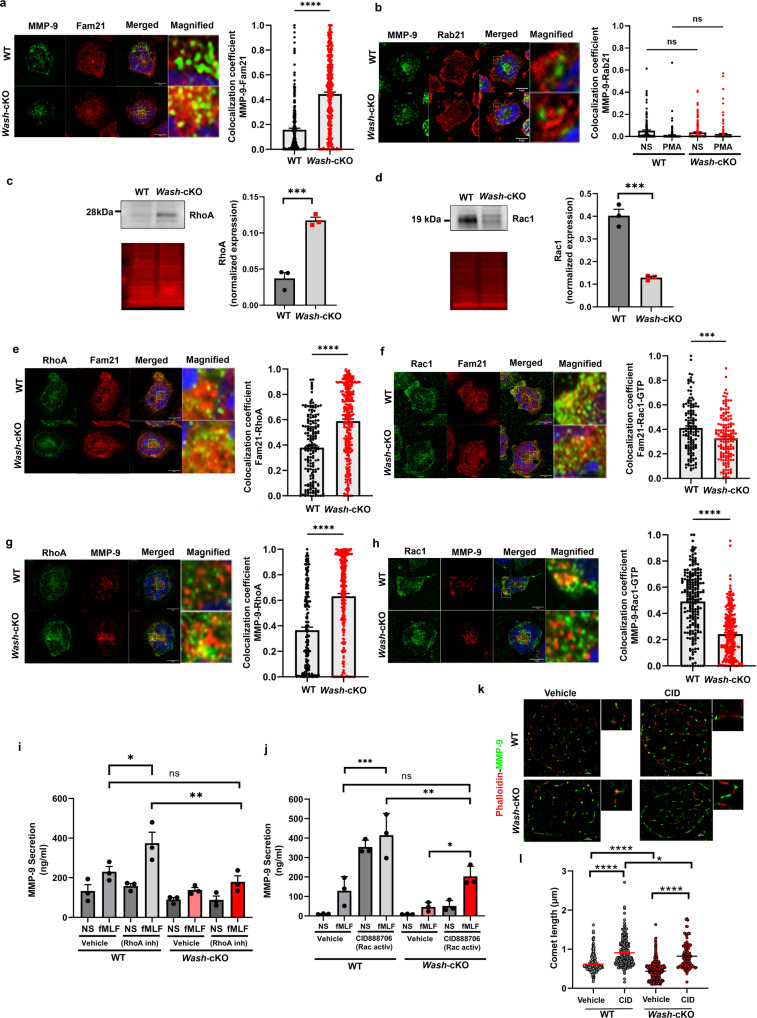
Fig. 5. RhoA/Rac1 inversion is associated with impaired gelatinase secretion in Wash-deficiency.
a Immunofluorescence analysis of the localization of endogenous FAM21 at gelatinase granules (MMP-9). Left, representative Airyscan images of WT and Wash-cKO (Washc1Δhaemo) neutrophils; Right, Quantitative analysis from 3 independent mice. A total of 165 WT and 169 Wash-cKO cells were analyzed. Mean ± SEM. ****p < 0.0001. b Analysis of the localization of Rab21 at gelatinase granules. Left, representative Airyscan images of WT and Wash-cKO neutrophils; Right, Quantitative analysis from 3 independent mice. A total of 152 and 188 WT, and 205 and 176 Wash-cKO, not stimulated (NS) or stimulated (PMA) cells, respectively, were analyzed. Mean ± SEM. Immunoblot analysis of the endogenous expression of total RhoA (c) and Rac1 (d) in neutrophils. Left, representative immunoblots (grey) and total protein loading (red). Right, Mean ± SEM, 3 independent mice. c ***p = 0.001; d ***p = 0.0007. e, f Colocalization of endogenous RhoA and Rac1-GTP with FAM21, respectively, by immunofluorescence. Left, representative Airyscan images of WT and Wash-cKO neutrophils; Right, Quantitative analysis from 3 independent mice. Mean ± SEM. ***p = 0.0001 and ****p < 0.0001. A total of 99 and 103 (e) and 107 and 117 (f) WT and Wash-cKO cells were analyzed. g, h Immunofluorescence analysis of the localization of RhoA and Rac1-GTP at gelatinase granules (n = 3). ****p < 0.0001. A total of 176 and 269 (g) and 100 and 115 (h) WT and Wash-cKO cells were analyzed. a–h Scale bar: 5 µm. a–h Two-tailed unpaired Student’s t-test. Three independent experiments. i, j Effect of RhoA inhibition (cell-permeable C3 Transferase, 2 µg/m) and Rac1 activation (CID888706, 10 µM) on gelatinase granule exocytosis (MMP-9 secretion). Mean ± SEM, n = 3. i *p = 0.0428; **p = 0.0038; j *p = 0.0410; **p = 0.0037 and ***p = 0.0002; ns, not significant. Ordinary one-way ANOVA, Tukey’s multiple comparisons test. k, l Effect of Rac1 activation on the actin comet defective phenotype of Wash-deficient neutrophils. k STORM super resolution images of actin comets (phalloidin, red) at gelatinase granules shown as MMP-9 molecular clusters (green). Representative of the data analyzed in l from three independent mice. Scale bar: 1 µm. l Quantitative analysis of actin comet length described in k. Mean ± SEM, from the analysis of 17, 13, 18 and 12 cells and 292, 205, 498 and 128 comets, from wild-type, Rac1-activated wild-type, Wash-cKO and Rac1-activated Wash-cKO cells respectively. CID, CID888706. Ordinary one-way ANOVA, Tukey’s multiple comparisons test. One outlier value in the WT-vehicle group (Grubb’s alpha = 0.05), length = 4.3 µm, (out of scale). Where indicated, *p = 0.0168; ****p < 0.0001. ns, not significant. Source data are provided as a Source Data file.

