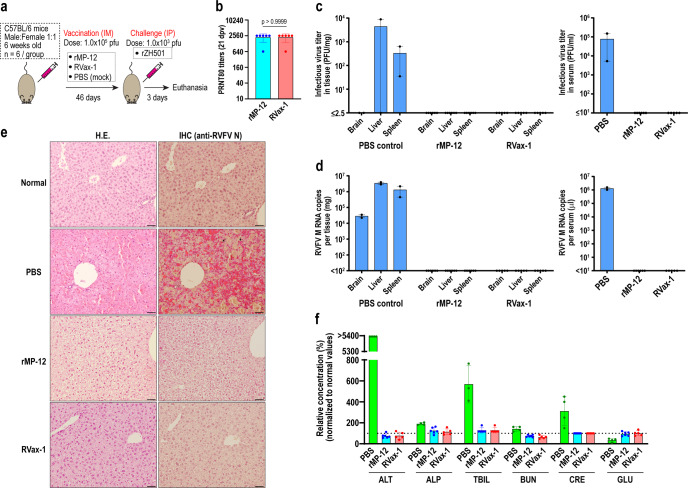
Fig. 6. Viral load and pathophysiological changes of mock and vaccinated C57BL/6 mice at 3 days post rZH501 challenge.
a Schematic representation of the vaccination and challenge experiment. C57BL/6 mice were IM mock-vaccinated or vaccinated with 1.0 × 10⁵ PFU of rMP-12 or RVax-1 (n = 6 per group), followed by rZH501 challenge at 46 dpv. All surviving mice were humanely euthanized at 3 days post rZH501 challenge (dpc). All mock-vaccinated mice died at 2 dpc, among which only two animals were available for virus titers, qRT-PCR, and histopathology examinations. One RVax-1-vaccinated animal died accidentally at 42 dpv during anesthesia. b Plaque Reduction Neutralizing Test 80 (PRNT80) antibody titers at 21 dpv are shown in a scattered dot plot graph with means ± standard deviations. Means were compared by unpaired t-test (t = 0, df = 10). c Infectious virus titers in brains, livers, and spleens (left panel), or sera (right panel) by plaque assay. Scattered dot plot graphs with means ± standard errors of tested samples are shown. d Copy number of viral M segment RNA was measured by Taqman qRT-PCR using the standard curve for in vitro synthesized RVFV M segment RNA. Scattered dot plot graphs with means ± standard errors of tested samples are shown. e H.E. stain or immunohistochemistry using anti-RVFV N antibody (IHC) for liver sections from untreated normal C57BL/6 mice, or rZH501-challenged, mock-vaccinated (PBS) or vaccinated (rMP-12 or RVax-1) mice. Arrows represent N antigen-positive cells in IHC. Bars represent 50 µm. f Relative concentration (% to the normal reference values) of alanine aminotransferase (ALT), albumin, alkaline phosphatase (ALP), total bilirubin (TBIL), blood urea nitrogen (BUN), creatinine (CRE), and glucose (GLU) in mouse blood at 3 dpc are shown in a scatter dot plot graph with the means ± standard deviations. Blood samples from four C57BL/6 mice that died at 3 days post rZH501 challenge in another experiment (Fig. 5) were used as the mock-vaccinated (PBS) control for the comparison.

