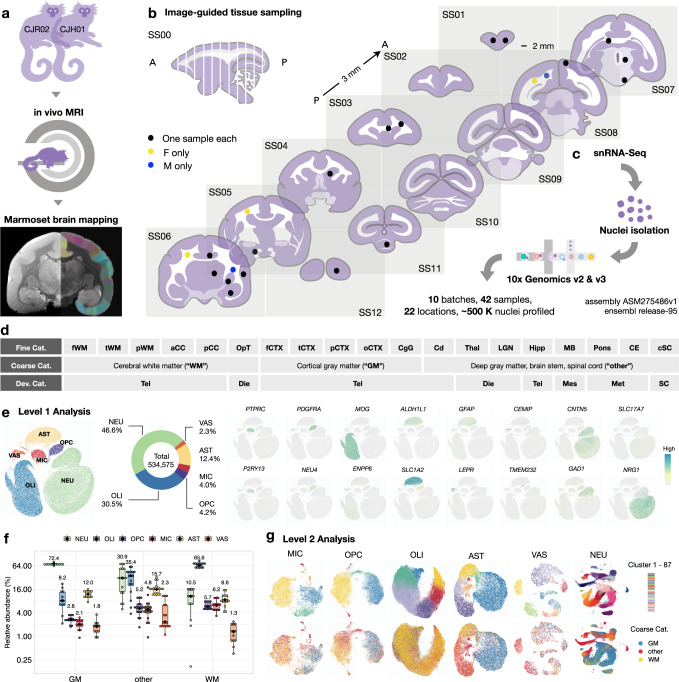
Fig. 1. Glial transcriptome reflects differential residence in gray and white matter.
a Experimental workflow to scan and map images to marmoset MRI atlases. b Location of samples collected as cylinders of 2 mm diameter and 3 mm thickness on the standard slab (SS) index. A anterior, P posterior. c Nuclei were isolated to prepare cDNA libraries and sequenced. d Total sampled areas are labeled by three types of tissue categories (Cat.): fine, coarse, and developmental (Dev). f frontal, t temporal, p parietal, WM white matter, a anterior, p posterior, CC corpus callosum, OpT optic tract, CTX cortex, o occipital, CgG cingulate gyrus, Cd caudate, Thal thalamus, LGN lateral geniculate nucleus, Hipp hippocampus, MB midbrain, CE cerebellum, cSC cervical spinal cord, Tel telencephalon, Die diencephalon, Mes mesencephalon, Met metencephalon, SC spinal cord. e The Level 1 analysis identified six cell classes, rendered as a uniform manifold approximation and projection (UMAP) scatter plot annotated by expression of canonical marker genes: neurons (NEU), oligodendrocytes (OLI), oligodendrocyte progenitor cells (OPC), microglia/immune cells (MIC), astrocytes (AST), and vascular/meningeal/ventricular cells (VAS). f Box plot showing the abundance of Level 1 clusters as a function of tissue type; n = 42 independent samples; the median is annotated (black diamond shape) and listed. The lower and upper hinges of the box plot correspond to the 25th and 75th percentiles; whiskers extend from the hinges to maxima or minima at most 1.5 times inter-quartile range. g Top, each level 1 cell class was further subclustered in level 2 analysis. Bottom, the UMAP plots from level 2 analysis are colored by coarse tissue category.

