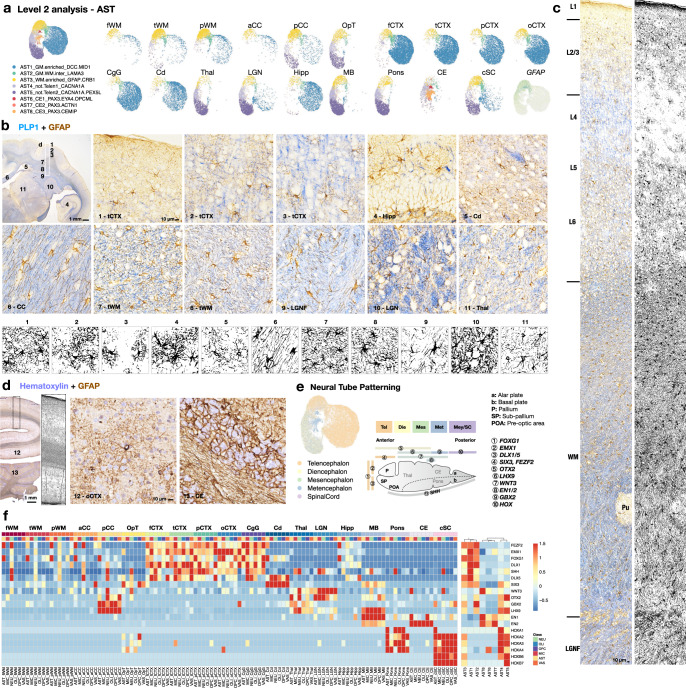
Fig. 6. Neural tube boundary-restricted astrocytes persist into adulthood.
a UMAP plot visualization of astrocytes (AST) colored by Level 2 subclustering and split by tissue type. b The expression of GFAP in a mid-coronal section of the marmoset brain. Intense PLP1 labeling demarcates the white matter. Enlarged areas are boxed and numbered on the 1x image (top left panel). The morphology of GFAP+ cells across tissue types was extracted by image processing (Method). The experiment was repeated independently three times with similar results. c The distribution and morphology of GFAP+ cells along layers of cortex and adjacent white matter. The experiment was repeated independently three times with similar results. d The expression of GFAP in the occipital lobe and cerebellum; nuclei are stained with hematoxylin. Enlarged areas are boxed and numbered on the 1x image. The experiment was repeated independently three times with similar results. e UMAP plot visualization of astrocytes colored by tissue type and developmental category (left). Schematic illustration of the expression of patterning genes along the anterior-posterior axis of the neural tube during development (right). f Heatmap showing the expression of selected patterning genes in Level 1 classes, split by sampling site. The sampling sites are ordered approximately along the anterior-posterior axis of the neural tube during development, from left to right; the genes enriched along the same axis are ordered from top to bottom. AST subclusters are grouped based on the expression similarity of these patterning genes, corresponding to the developmental origins of the sampling sites.

