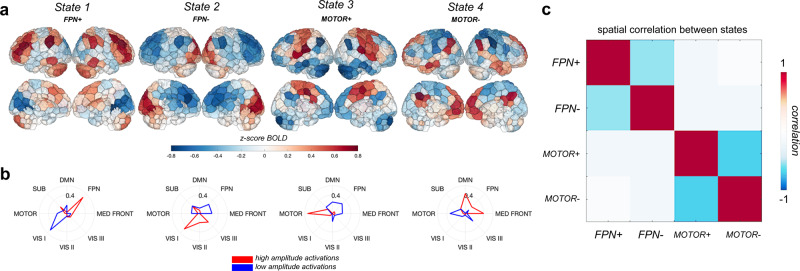
Fig. 2. Four brain activity states.
a Centroids of each state calculated as the mean of the normalized regional activation over all TRs assigned to that state. b Radial plots displaying cosine similarity between each cluster and each canonical network; red indicates cosine similarity of the high amplitude activations, blue indicates cosine similarity of the low amplitude activations. Labels for each state were derived from analyzing the magnitude and type of overlap of each centroid with the 8 canonical networks. c Region-level correlation of each pair of brain state centroids. DMN default mode network, FPN frontoparietal network, MED FRONT medial frontal network, VIS III visual association network, VIS II visual network 2, VIS I visual network 1, MOTOR motor network, SUB subcortical/cerebellum network.

