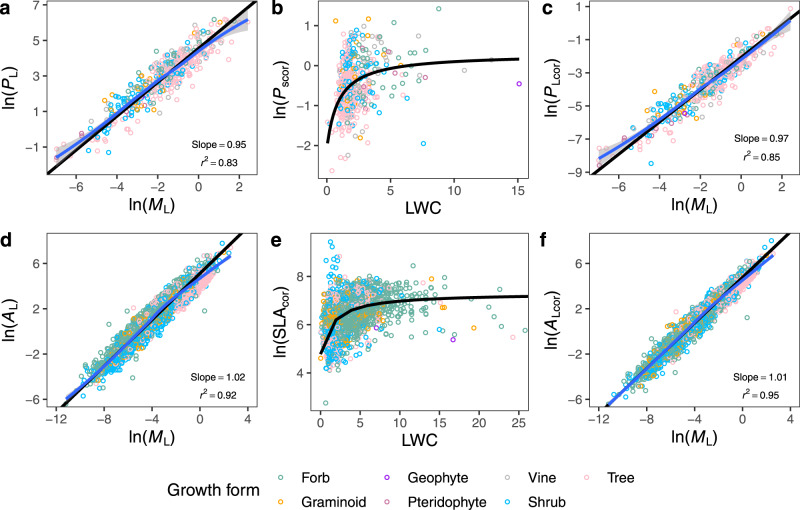
Fig. 2. The quantitative effects of dry mass-based leaf water content (LWC) on leaf photosynthesis and SLA.
a Scaling of leaf photosynthetic rate (PL, nmol s−1) with leaf dry mass (ML, g). b Non-linear fit to the relationship between temperature-corrected mass-specific leaf photosynthetic rate (Pscor, nmol g−1 s−1) and LWC (g g−1) based on Eq. (3). c Scaling of temperature- and LWC-corrected leaf photosynthetic rate (PLcor, nmol s−1) with ML (g). d Scaling of leaf area (AL, cm2) with leaf dry mass (ML, g). e Non-linear fit to the relationship between temperature-corrected specific leaf area (SLAcor, cm2 g−1) and LWC based on Eq. (6). f Scaling of temperature- and LWC-corrected leaf area (ALcor, cm2) with leaf dry mass (ML, g). Data with LWC greater than 25 were not shown in panel e for a better visualisation. LOWESS curves (blue lines) and 95% confidence intervals are shown.

