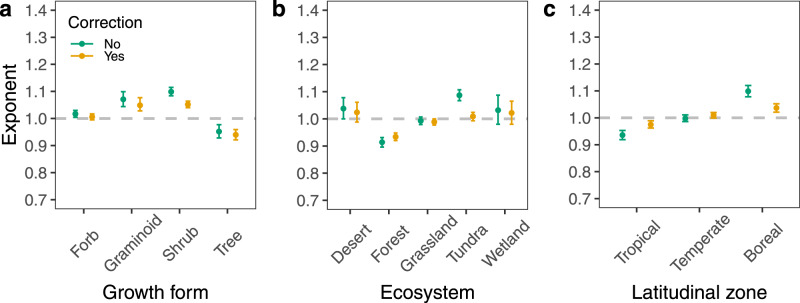
Fig. 3. The exponents of leaf area-mass scaling with and without temperature and LWC corrections among different groups.
a Comparison of scaling exponents among plant growth forms (n = 1688, 491, 1097, and 832 for forbs, graminoids, shrubs, and trees, respectively). b Comparison of scaling exponents among ecosystem types (n = 97, 1367, 1285, 1271, and 114 for deserts, forests, grasslands, tundra, and wetlands, respectively). c Comparison of scaling exponents among different latitudinal zones (n = 1111, 2113, and 910 for tropical, temperate, and boreal zones, respectively). Error bars indicate 95% confidence intervals.

