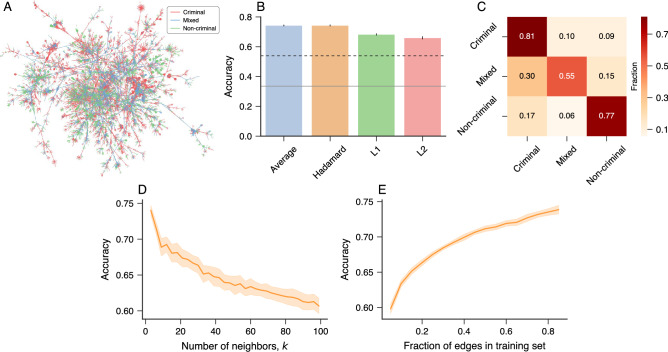
Figure 2.
Determining the types of association in criminal networks. (A) Visualization of the three different types of association among people in the giant component of the Brazilian criminal intelligence network. Edges in red, blue, and green represent criminal relationships, mixed relationships, and non-criminal relationships, respectively. (B) Accuracy of k-nearest neighbor classifiers (kNN with ) trained with node2vec representations and different binary operators. The bars stand for the average accuracy estimated from test sets over ten realizations of the embedding and training processes (error bars represent one standard deviation). The gray continuous line represents the accuracy of a dummy classifier that makes random predictions based on the relative frequency of each type of association in the training set, and the black dashed line indicates the accuracy of a dummy classifier that always predicts the most common type of association in the training set (criminal edge). (C) Confusion matrix associated with the kNN classifier predictions (with and the Hadamard operator) for the type of criminal associations in the test sets (rows indicate true labels). (D) Average accuracy in the test sets as a function of the number of neighbors (k) in the kNN classifiers. (E) Average accuracy in the test sets as a function of the fraction of edges in the training sets. In the last two panels, the solid lines indicate the average accuracy, and the shaded regions stand for one standard deviation band estimated over ten realizations of the embedding and training processes with the Hadamard operator.

