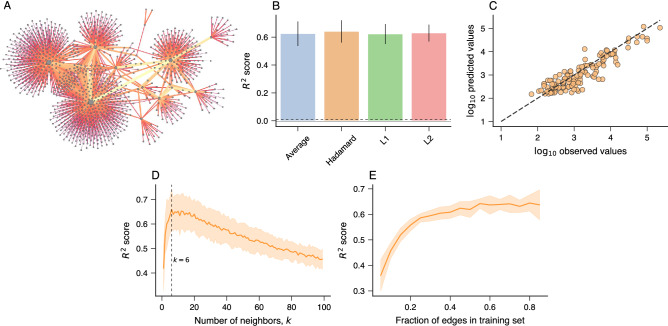
Figure 3.
Predicting the total amount of money exchanged among agents of the criminal financial network. (A) Visualization of the criminal financial network. Nodes represent agents (people or companies) and edges indicate financial transactions. The thicker the edge and lighter its color, the larger the amount exchanged between a pair of nodes. (B) Coefficient of determination ( score) of the association between the logarithm of the predicted and observed amounts of money exchanged between pairs of nodes in the test sets. These predictions are obtained using k-nearest neighbor regressors (kNN with ) trained with node2vec representations of edges and different binary operators. The bars stand for the average accuracy and error bars represent one standard deviation over ten realizations of the embedding and training processes. The gray continuous line represents the accuracy of a baseline regressor that always predicts the average value of the training set, and the black dashed line represents the accuracy of another dummy regressor that always predicts the median of the training set. (C) A typical example of the relationship between the base-10 logarithm of the predicted and observed amounts of money exchanged between pairs of nodes in the test sets obtained with a kNN regressor () trained with node2vec representations of edges and the Hadamard operator. The dashed line represents the 1:1 relationship. (D) Average score as a function of the number of neighbors (k) in the kNN regressors estimated from the test sets. The vertical dashed line indicates the optimal number of neighbors (). (E) Average score on the test sets as a function of the fraction nodes in the training sets. In the last two panels, the solid lines indicate the average score, and the shaded regions stand for one standard deviation band estimated over ten realizations of the embedding and training processes with the Hadamard operator.

