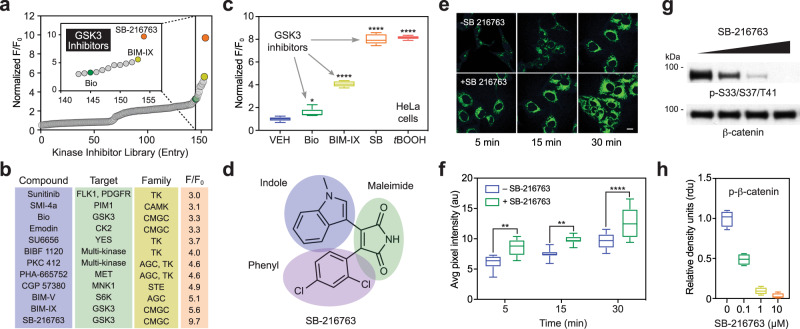
Fig. 5. Multi-well-based screening identifies kinase inhibitors that elevate cysteinyl oxidation in cells.
a Relative fluorescence intensity of HeLa cells treated with various kinase inhibitors (10 µM) and CysOx2 (50 µM) after 1 h at 37 °C. b Twelve compounds demonstrated a relative increase in fluorescence intensity of 3-fold or greater. The primary target and kinase family for each compound is listed. c Three GSK3 inhibitors were identified among the top ten hits: Bio, BIM-IV (BIM) and SB-216763 (SB). These inhibitors were purchased, manufacturers’ purity was verified by LC-MS, and then rescreened in HeLa cells at 1 µM in the presence or absence of CysOx2 (50 µM). The concentration of t-BOOH control was 2 mM. Box plots show center line as median, whiskers show maxima and minima, and box limits show upper and lower quartiles. The variance was analyzed by one-way ANOVA test. *P = 0.035 and ****P < 0.0001 when compared against cells treated with vehicle only. d General structure of disubstituted maleimide-based GSK3 inhibitors. e No-wash live-cell confocal images of HeLa cells at different time points after the addition of CysOx2 (5 µM) in the presence or absence of SB-216763 (0.1 µM). λex = 458 nm; scale bar: 50 µM. Representative images are shown from N = 3 independent experiments. f Average pixel intensities from panel e. Data are representative of ten independent readings from five different frames. Error bars represent ±SEM. The variance was analyzed by two-way ANOVA test. At 5 min: **P = 0.0010; at 15 min: **P = 0.0025; at 30 min: ****P < 0.0001 when compared to cells treated with probe only. Box plots show center line as median, whiskers show maxima and minima, and box limits show upper and lower quartiles. g Cells were treated with vehicle or with 0.1, 1 or 10 µM (left to right) SB-216763 for 30 min and then 50 nM calyculin. h Phospho-β-catenin-S33/S37/T41 and total β-catenin band densities were determined for each blot and expressed as relative density units (rdu). Bars denote ±SEM. N = 3 independent experiments. Box plots show center line as median, whiskers show maxima and minima, and box limits show upper and lower quartiles.

