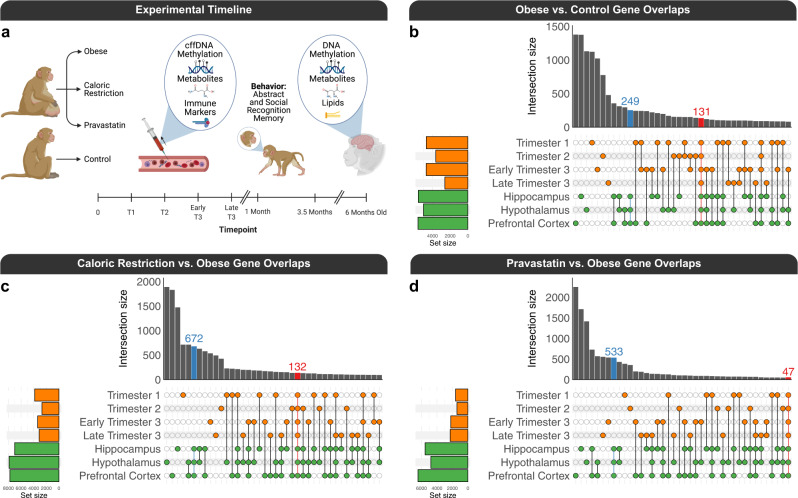
Fig. 1. cffDNA and brain DMR overlaps.
a Experimental design and timeline (created with BioRender.com). UpSet plots of the overlaps of gene mappings from pairwise DMR comparisons of b obese vs. control for cffDNA from trimester 1 (nobese = 7, ncontrol = 4), trimester 2 (nobese = 7, ncontrol = 4), early trimester 3 (nobese = 7, ncontrol = 5), and late trimester 3 (nobese = 7, ncontrol = 6) as well as infant brain (nobese = 7, ncontrol = 6 for hippocampus, hypothalamus, and prefrontal cortex), c caloric restriction vs. obese for cffDNA from trimester 1 (ncaloric restriction = 4, nobese = 7), trimester 2 (ncaloric restriction = 5, nobese = 7), early trimester 3 (ncaloric restriction = 5, nobese = 7), and late trimester 3 (ncaloric restriction = 7, nobese = 5) as well as infant brain (ncaloric restriction = 5, nobese = 7 for hippocampus, hypothalamus, and prefrontal cortex), and d pravastatin vs. obese for cffDNA from trimester 1 (npravastatin = 7, nobese = 7), trimester 2 (npravastatin = 7, nobese = 7), early trimester 3 (npravastatin = 7, nobese = 7), and late trimester 3 (npravastatin = 7, nobese = 7) as well as infant brain (npravastatin = 7, nobese = 7 for hippocampus, hypothalamus, and prefrontal cortex). Source data are provided as a Source Data file.

