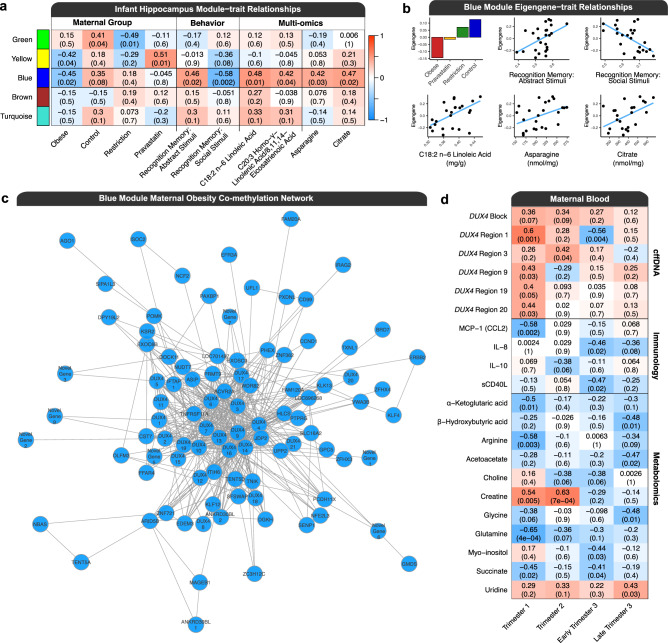
Fig. 4. Weighted gene co-methylation network (WGCNA) of infant hippocampus.
a Module-trait correlations within the hippocampus. The heatmap colors are representative of the correlation between the module eigengenes and the trait of interest. The obesity group refers to maternal obesity with no intervention. Pearson’s correlation coefficients (r) are reported above their p values, which are in parentheses, and these values also apply to the plots in part B of the figure. b Bar plot of the mean eigengene values for the blue module in each maternal group, and scatter plots of all animals across all four groups with a line of best fit for the eigengene values and abstract stimuli recognition memory score ratios, social stimuli recognition memory score ratios, linoleic acid concentrations, asparagine concentrations, and citrate concentrations. c The blue module maternal obesity co-methylation network. Regions were mapped to their nearest gene and novel genes were labeled with mammalian ortholog symbols, if available. Genes represented by more than one region were appended with a unique number identifier. Edges were included in the network if they passed an adjacency threshold and thus not all genes in the module are represented in the visualization. d Hippocampal blue module-trait correlations with maternal blood measurements of DUX4 cffDNA methylation levels, immunological markers, and metabolites across all trimesters of pregnancy. Source data are provided as a Source Data file.

