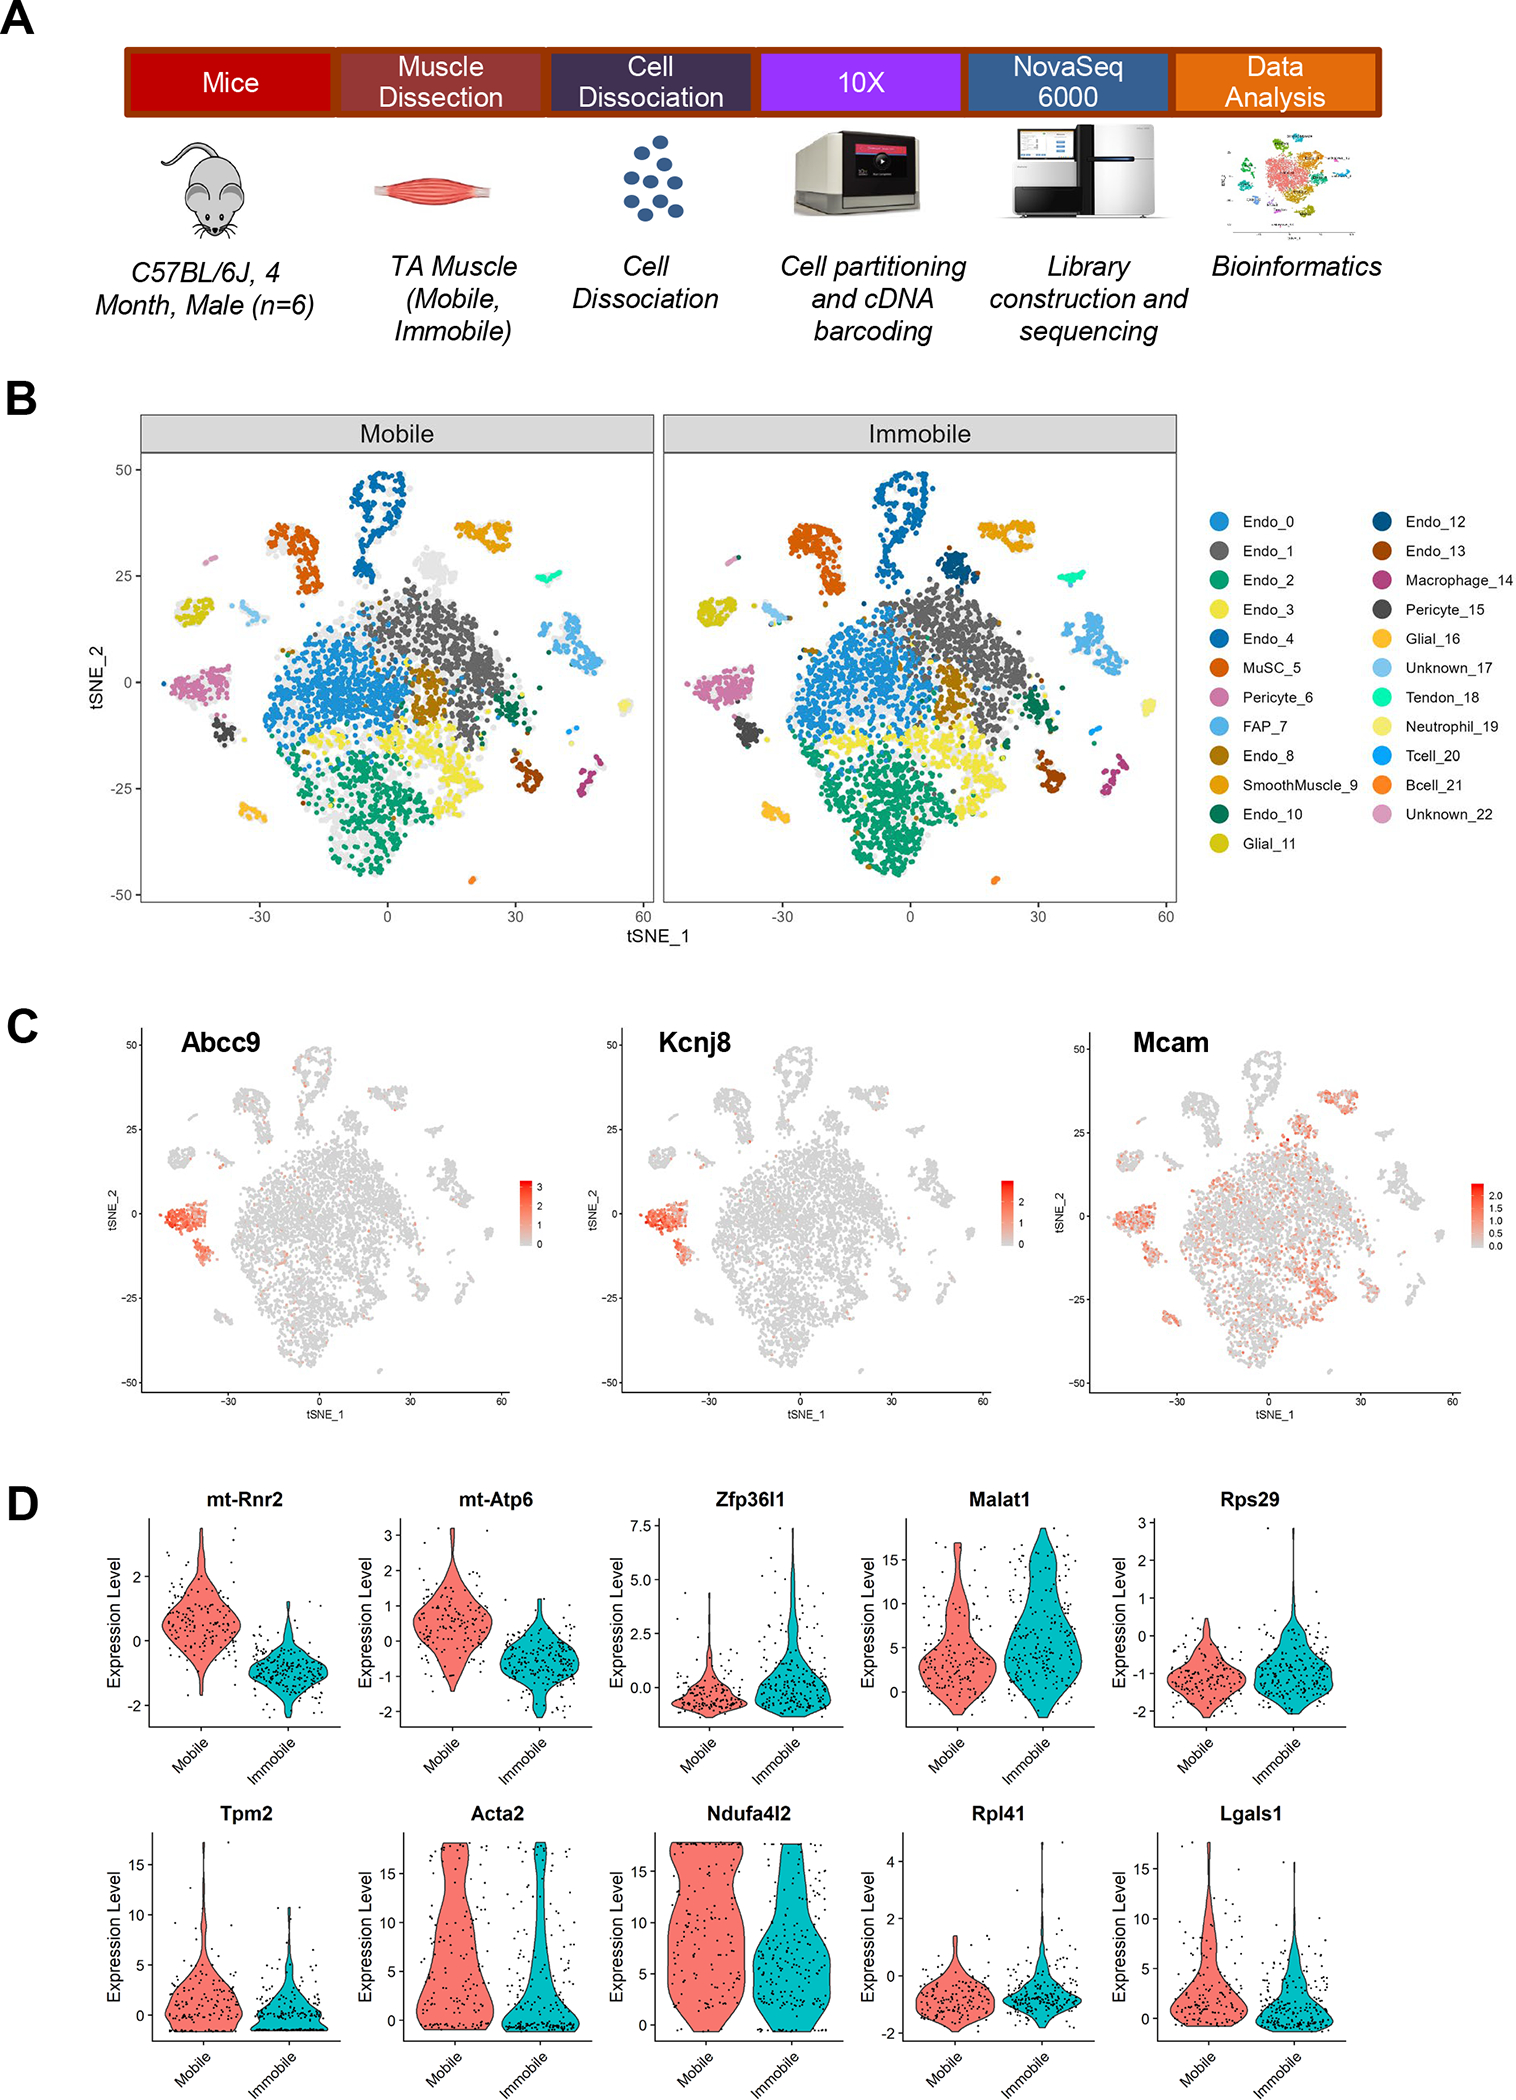
Figure 1. Single-cell Analysis of Skeletal Muscle After 2 Weeks of Immobilization.

(a) Schematic diagram of experimental design for scRNA-Seq. Mice (C57BL/6J, 4 month-old, male; n=6) were subjected to 2 weeks of unilateral limb stapling and immobilization. Tibialis anterior muscles were collected from mobile and immobile limbs and separately pooled prior to preparation of single-cell suspensions by mechanical and enzymatic dissociation. After exclusion of debris and doublets from single-cell suspensions, cells were loaded into the 10X Chromium system. Library preparation and sequencing was performed on the NovaSeq 6000 platform and raw data were processed by Cell Ranger (v. 3.0.2) to generate a gene-cell expression matrix. Further data analysis was carried out using Seurat (v. 3.1.4). After gene and cell filtering, 17,927 genes were detected in 4,224 Mobile cells and 5,404 Immobile cells. (b) t-Stochastic neighbor embedding (tSNE) plots showing the distribution of the 23 primary cell populations identified in TA muscle in the mobile control limbs versus the immobilized limbs. Each dot represents a single cell; light gray dots show relative positions of cells from the other sample for comparison. Endothelial cluster 12 was only present after immobilization. (c) Marker expression illustrated by cluster. Pericyte clusters 6 and 15 were identified by expression of Abcc9 and Kcnj8. (d) Top 10 genes differentially expressed in pericyte cluster 6.
