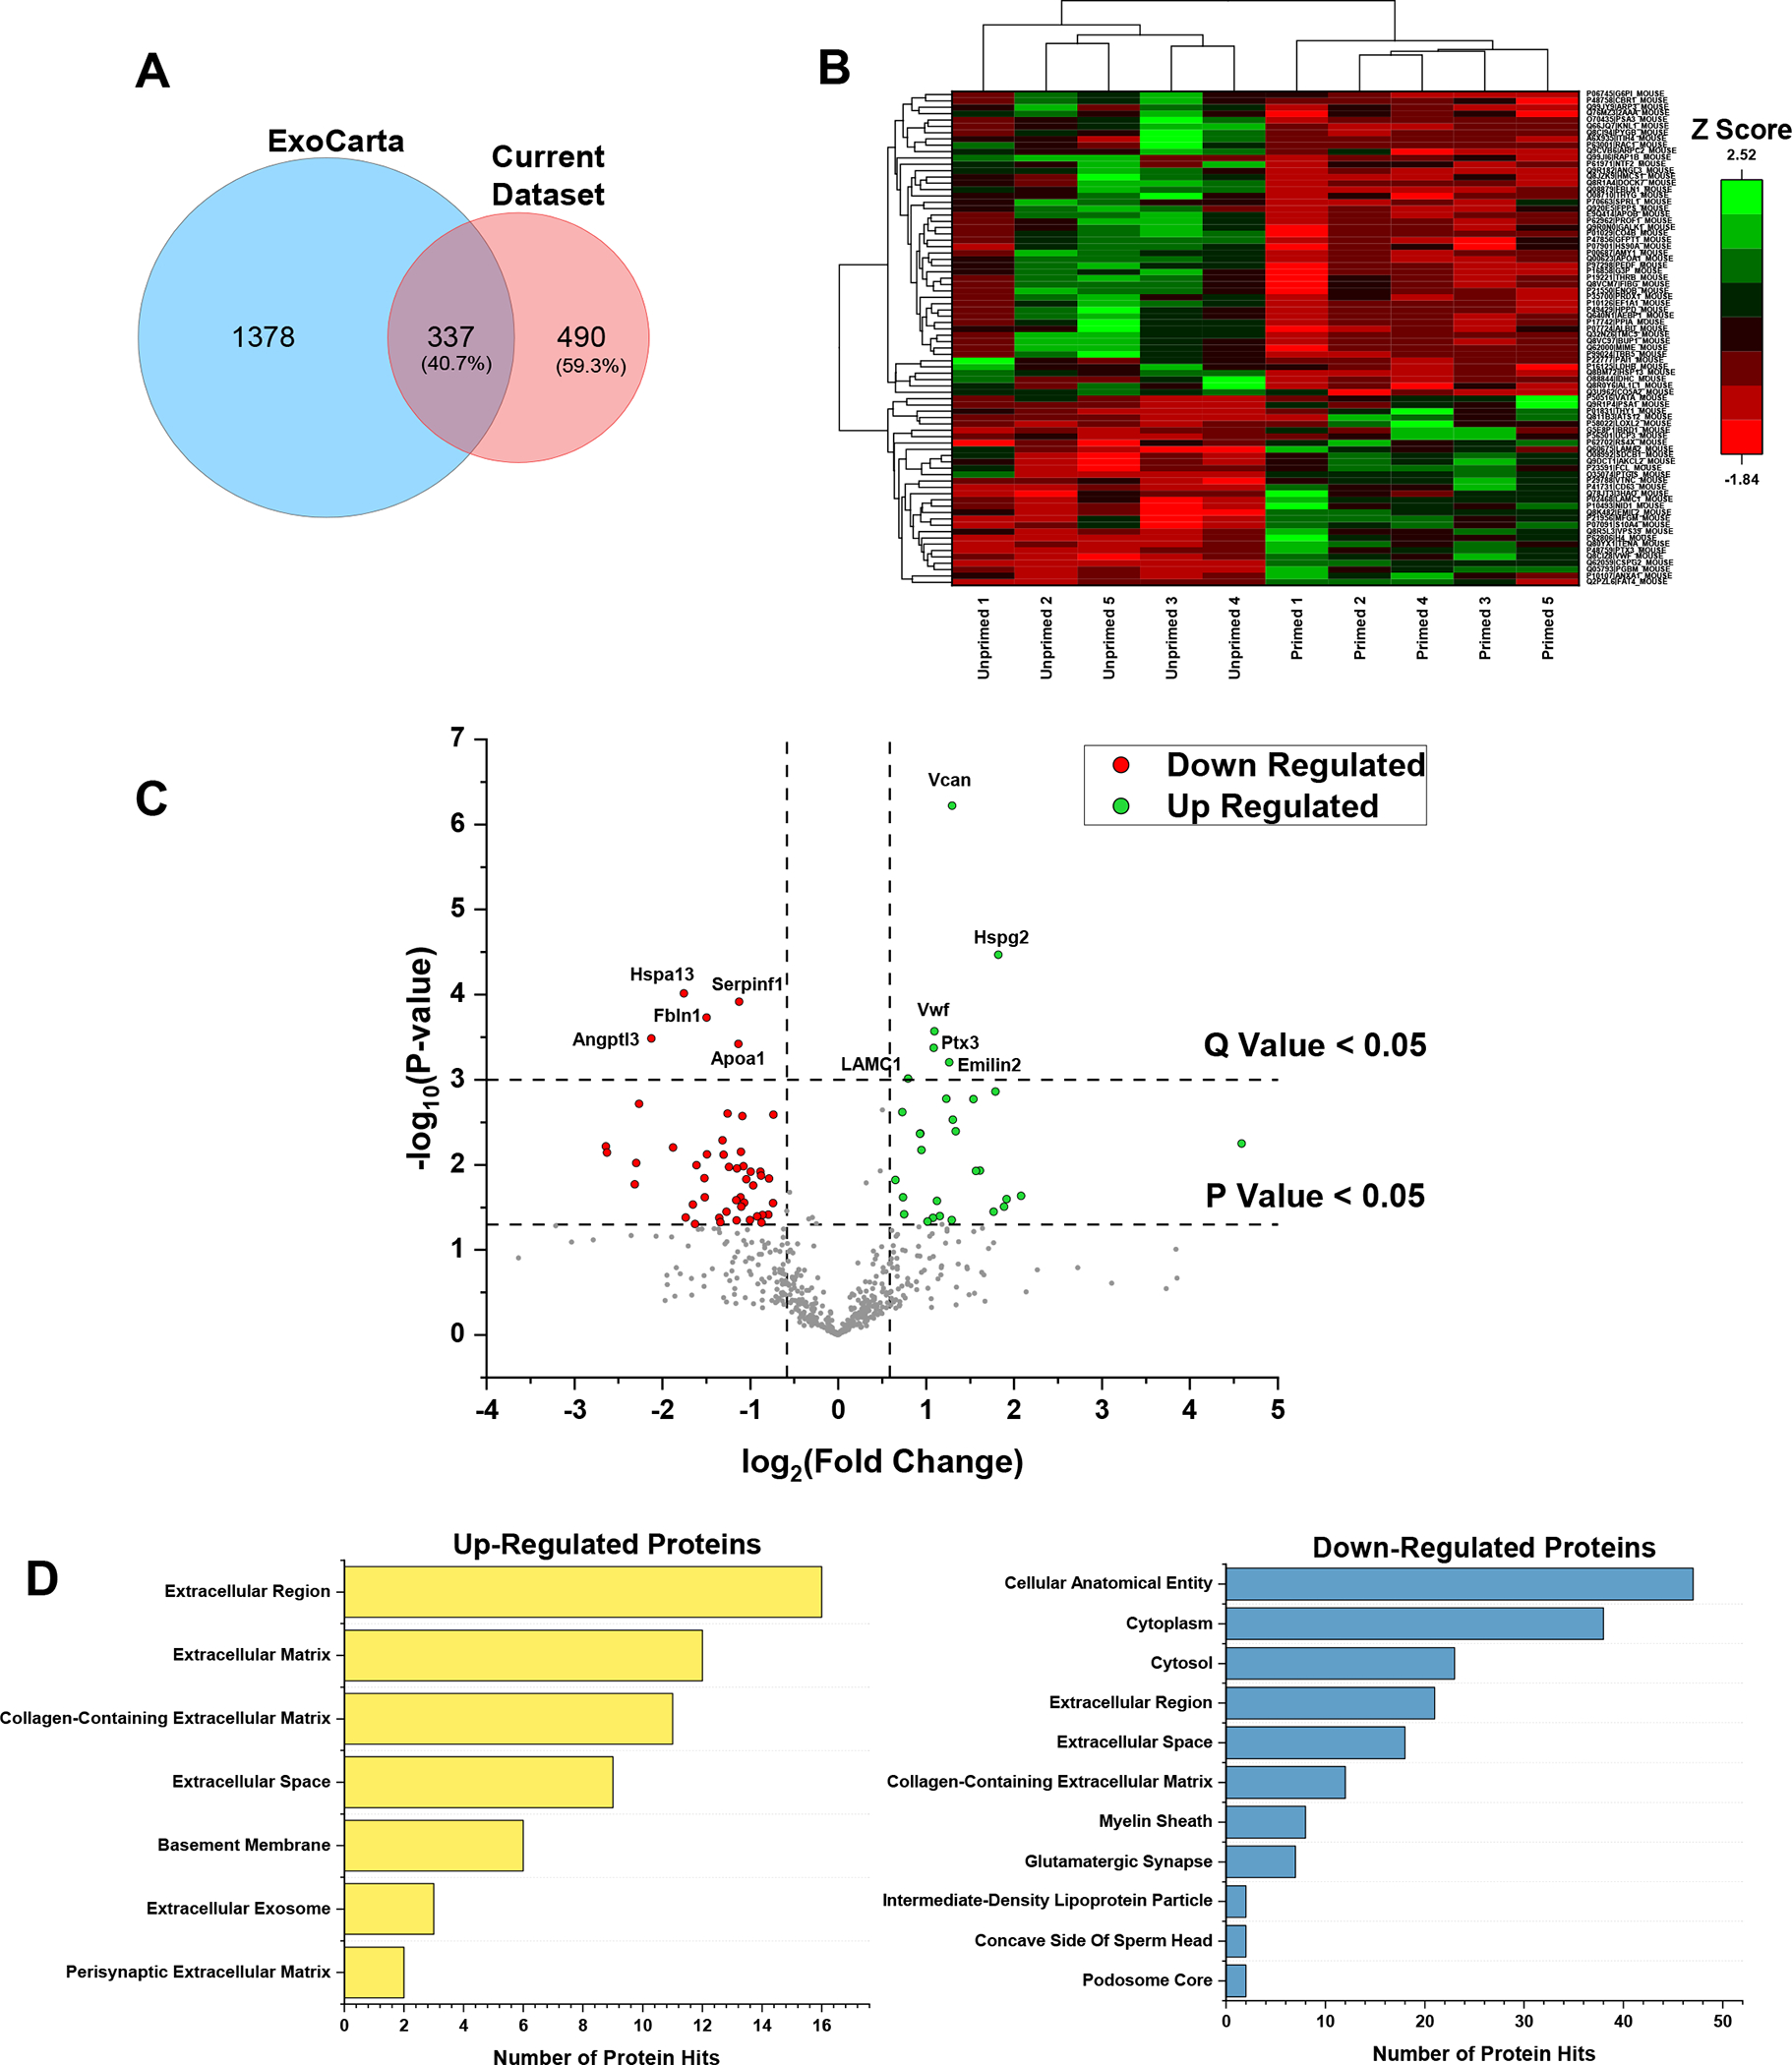
Figure 5. Proteomic Analysis of H2O2-Primed Pericyte-Derived EVs.

(a) Venn diagram showing the unique number of proteins in ExoCarta and in the current dataset. (b) Heat map representing the abundance in terms of Z scores for the up- and down-regulated proteins in H2O2-primed pericyte-derived EVs (Primed EV) relative to the unprimed pericyte-derived EVs (Ctrl EV). (c) Volcano plot showing the up-regulated (green) and down-regulated (red) proteins based on having a Q value less than 0.05. (d) GO analysis for the up- and down-regulated proteins depicting the enriched GO terms in the cellular component category. n=5/group.
