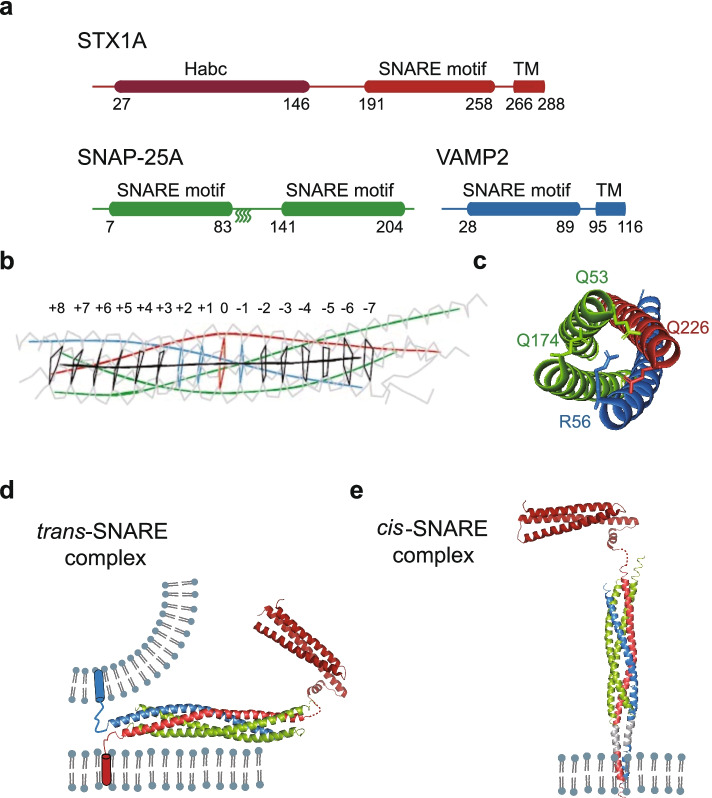
Fig. 3.
SNARE proteins and SNARE complex. a Domain diagrams of the STX1A (red) with Habc domain (dark red), SNAP-25A (green) and VAMP2 (blue). For SNAP-25A, the palmitoylation sites within the cysteine cluster (C85, C88, C90, C92) of the linker region are presented as curve lines. The numbers of residues are indicated below each diagram. The color code for each SNARE protein is the same in other figures. TM, transmembrane. b 16 stacked layers (Red: 0; Blue: -1, + 1 and + 2, that are closest to the ideal leucine-zipper geometry; Black: others) of the SNARE complex are indicated in Cα traces (gray), the superhelical axis (black), the helical axes of STX1A, SNAP-25A and VAMP2 are shown as red, green, and blue respectively. c The side chains involved in the ionic “0” layer of SNARE complex are shown as sticks. d The ribbon diagram shows the structure of the trans-SNARE complex in Rattus norvegicus (PDB ID: 1SFC) [217] with STX1A Habc domain (PDB ID: 3C98) [218] on two opposing membranes. e The ribbon diagram shows the structure of the cis-SNARE complex in Rattus norvegicus (PDB ID: 3IPD) [219] on plasma membrane after a full fusion event. The copyright permission of panels b and c are from [217]

