Fig. 4.
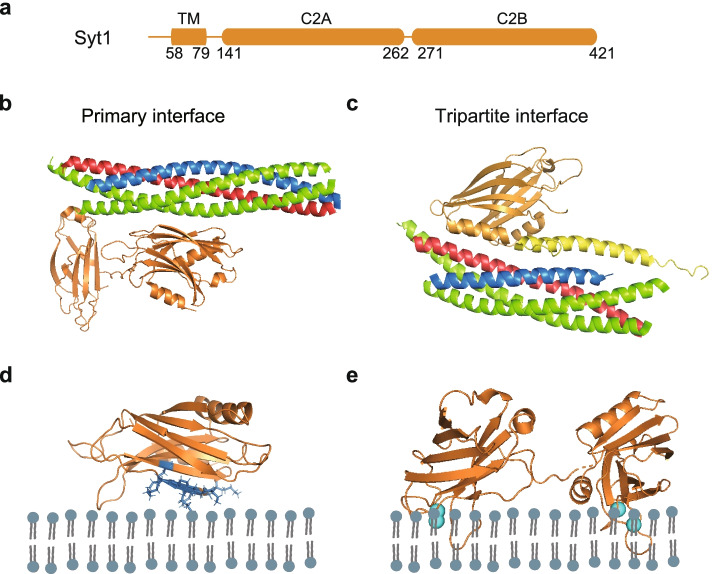
Syt1 and its interactions with SNARE complex and membrane. a Domain diagram of Syt1. Residue numbers are indicated below the diagram. b Crystal structure of the primary interface of SNARE-Syt1 complex in Rattus norvegicus (PDB ID: 5CCI) [240]. c Crystal structure of the tripartite interface of SNARE-Syt1-Cpx1 complex in Rattus norvegicus (PDB ID: 5W5D) [241]. d Model of polybasic region of C2B domain interacting with the anionic membrane (PDB ID: 1K5W) [242]. The side chains of the residues in the polybasic region (K313, K321, R322, K324, K326, K325 and K327) are shown in blue sticks. e Crystal structure of the tandem Syt1 C2AB (orange) domains in Rattus norvegicus (PDB ID: 5KJ7) [239] in the presence of Ca2+ (cyan sphere)

