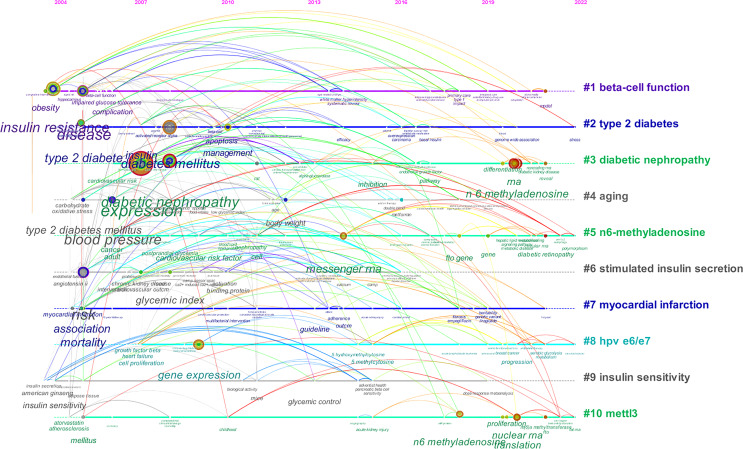
Figure 11.
CiteSpace visualization timeline view of keywords clustering analysis related to RNA methylation in DM and its complications. The different colored horizontal lines with the label on the right represent the clusters formed by the keywords, the nodes on the horizontal lines represent the keywords, and the position of the nodes on the horizontal lines represents the year in which the literature containing the keywords first appeared, thus forming the timeline of the keywords cluster evolution.

