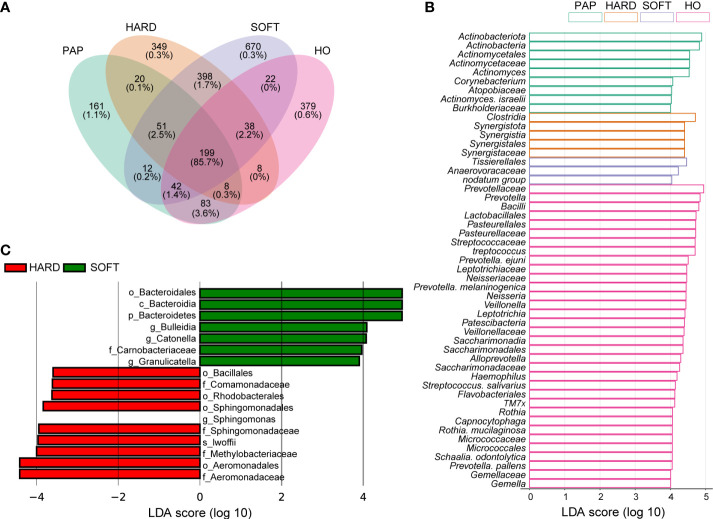
Figure 3.
Distribution of the microbiota composition and biomarkers. (A) Venn diagram of the taxonomic distribution, the percentage under OTU numbers represent reads percentages of all sequencing data. (B-C) The result of linear discriminant analysis integrated with effect size (LEfSe). Microbial marker taxa with significant abundance differences among HO, PAP, HARD and SOFT (B) and between HARD and SOFT (C) (LDA > 3.5, p < 0.05).

