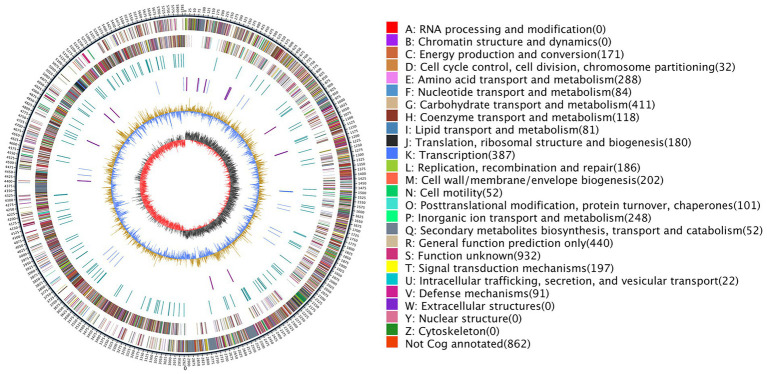
Figure 3.
Genome map of Paenibacillus peoriae ZBSF16. The distribution of the circle from the outside indicates the genome size, forward CDS, reverse CDS, repeat sequence, tRNA (blue), rRNA (purple), GC ratio (yellow and blue indicate regions where the GC ratio is higher than average and lower than average, respectively), and CG skew positive (dark) and negative (red).

