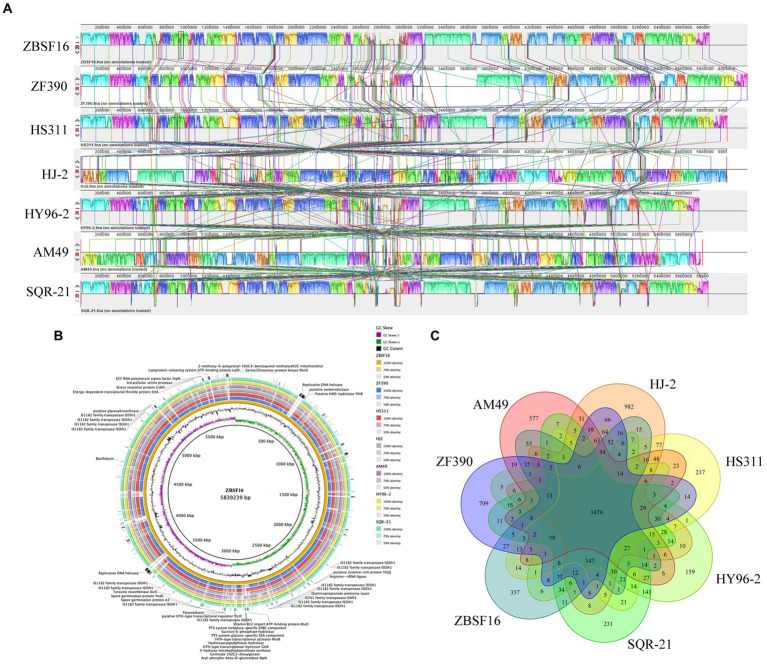
Figure 5.
Comparison of Paenibacillus peoriae ZBSF16 genome sequences against six other Paenibacillus genome sequences. (A) Synteny analysis of P. peoriae ZBSF16 with the P. peoriae ZF390, P. peoriae HS311, P. peoriae HJ-2, P. polymyxa HY96-2 P. polymyxa SQR-21 and P. kribbensis AM49 genomes. Pairwise alignments of the genomes were generated using MAUVE. The genome of strain ZBSF16 was used as the reference genome. Boxes with the same color indicate syntenic regions. Boxes below the horizontal strain line indicate inverted regions. Rearrangements are shown by colored lines. Scale is in nucleotides. (B) Pangenome analysis with closely related strains identified the unique genes present in the query genomes that are highlighted in the outermost circle, the strain ZBSF16 as the query genome is placed in the innermost circle. (C) Venn diagram showing the number of clusters of orthologous genes shared and unique genes.

