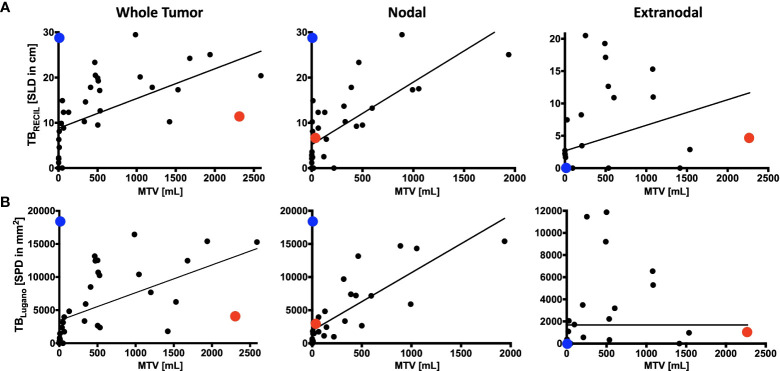
Figure 2.
Comparison of RECIL, Lugano and Metabolic Tumor Burden Quantification. Depicted is the correlation of tumor burden at baseline PET/CT prior to CAR T-cell therapy according to RECIL (TBRECIL; A) and Lugano criteria (TBLugano; B) on the y-axis to metabolic tumor volume (MTV) on the x-axis. Tumor burden is shown as whole tumor burden on the left, nodal tumor burden in the middle and extranodal tumor proportion on the right. An extreme outlier with high MTV to TBRECIL/TBLugano ratio was marked with red. Another outlier with high TBRECIL/TBLugano compared to MTV was marked with blue. The disease phenotypes of these two cases will be illustrated in Figure 3 .

