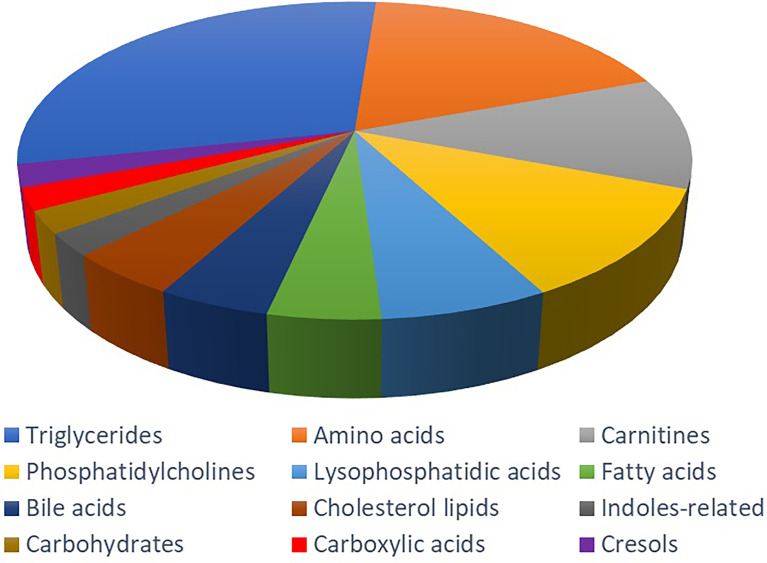
Figure 4.
Metabolite classification analysis. The pie chart shows the 41 metabolites, including triglycerides (31.70%), amino acid (19.51%), carnitine (12.20%), phosphatidylcholine (12.20%), lysophosphatidic acid (7.32%), fatty acid (4.88%), bile acid (4.88%), cholesterol lipids (4.88%), indoles-related metabolites (2.44%), carbohydrate (2.44%), carboxylic acid (2.44%) and cresol (2.44%).

