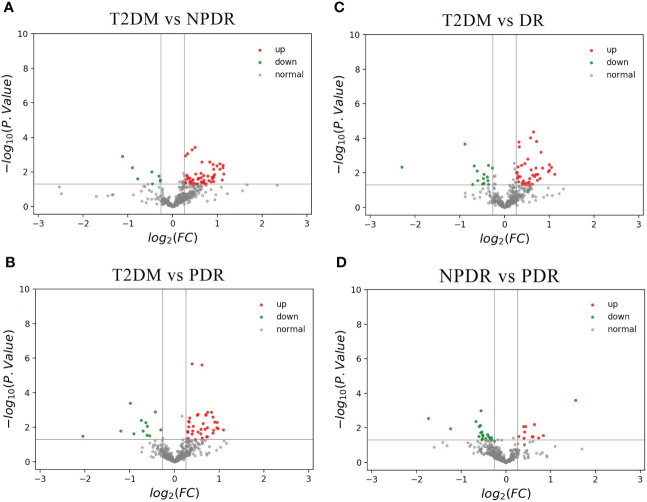
Figure 5.
(A) The volcano map of the log2 (FC) and −log10 (p-value) showed that 65 differential metabolites were significantly different between T2DM samples (n = 9) and NPDR samples (n = 10). Compared with NPDR samples, 57 metabolic features were significantly increased (red dots) and 8 metabolic features were significantly decreased (green dots) in T2DM samples. (B) The volcano map of the log2 (FC) and −log10 (p-value) showed that 48 differential metabolites were significantly different between T2DM samples (n = 9) and PDR samples (n = 10). Compared with PDR samples, 36 metabolic features were significantly increased (red dots) and 12 metabolic features were significantly decreased (green dots) in T2DM samples. (C) The volcano map of the log2 (FC) and −log10 (p-value) showed that 56 differential metabolites were significantly different between T2DM samples (n = 9) and DR samples (n = 20). Compared with DR samples, 41 metabolic features were significantly increased (red dots) and 15 metabolic features were significantly decreased (green dots) in T2DM samples. (D) The volcano map of the log2 (FC) and −log10 (p-value) showed that 31 differential metabolites were significantly different between NPDR samples (n = 10) and PDR samples (n = 10). Compared with PDR samples, 12 metabolic features were significantly increased (red dots) and 19 metabolic features were significantly decreased (green dots) in NPDR samples. FC, fold change; T2DM, type 2 diabetes mellitus; NPDR, non-proliferative diabetic retinopathy; PDR, proliferative diabetic retinopathy.

