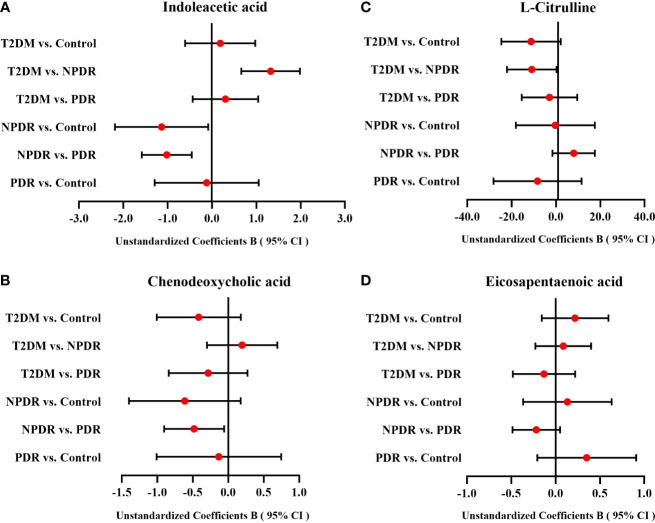
Figure 7.
The forest plots of IAA, CDCA, Cit and EPA among groups. After multiple linear regression analyses of age, diabetes duration, FPG and HbA1 for differential metabolites between groups, (A) the serum level of IAA between T2DM group and NPDR group, NPDR group and control group, and NPDR group and PDR group were statistically significant, (B) the serum level of CDCA between NPDR group and PDR group was also statistically significant, and (C) the serum Cit level between T2DM group and NPDR group was of borderline statistical significance. (D) The serum levels of EPA which showed no statistically significant difference among the groups. CI, confidence interval; T2DM, type 2 diabetes mellitus; NPDR, non-proliferative diabetic retinopathy; PDR, proliferative diabetic retinopathy; Cit, L-Citrulline; IAA, Indoleacetic acid; 1-MH, 1-Methylhistidine; CDCA, Chenodeoxycholic acid; EPA, Eicosapentaenoic acid.

