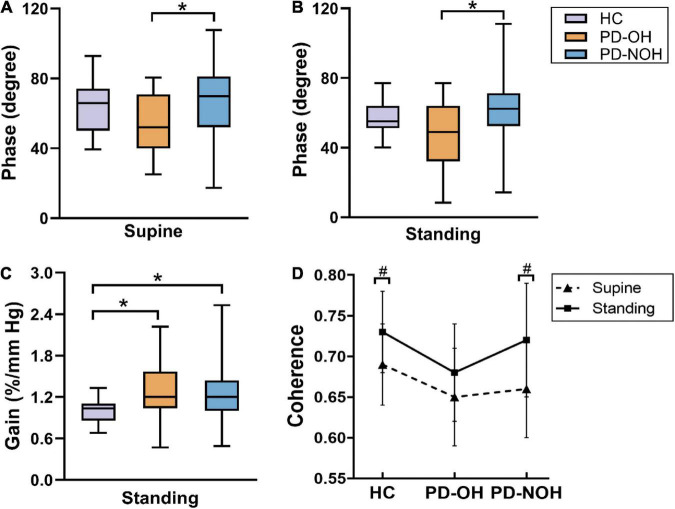
FIGURE 1.
Comparison of autoregulation parameters between groups in VLF. (A,B) The phase difference from the PD-OH group is significantly lower than that of PD-NOH on both body postures. (C) During standing, there is significant difference in normalized gain between three groups. (D) The coherence of the standing position is higher than that of the supine in PD-NOH and HC. *Indicates P < 0.05; #Indicates P < 0.05 for comparison with supine; The whiskers in subplots (A–C) indicate the data range, and the error bars in subplot (D) indicates standard deviation. Eighty-nine PD patients and 20 HC in supine, 83 PD patients, and 20 HC in standing.

