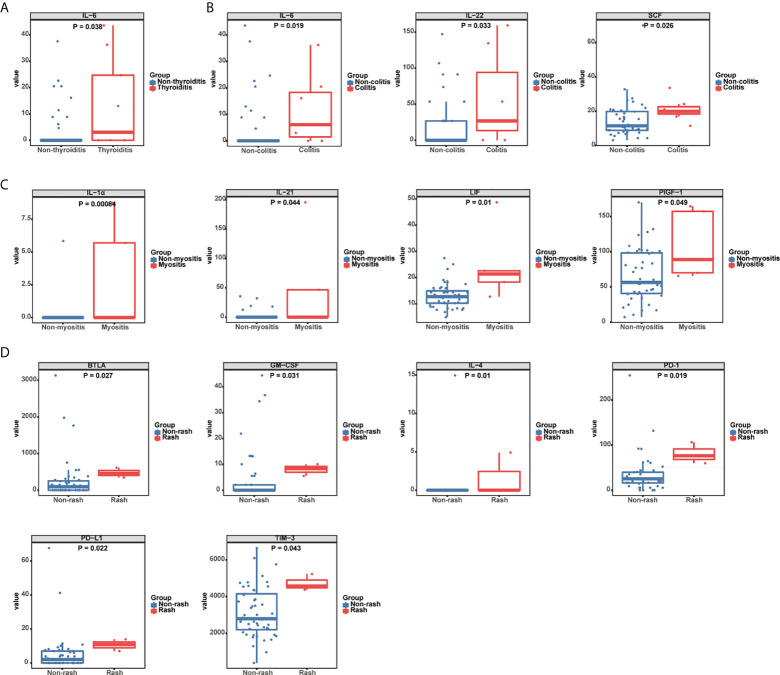
Figure 2.
Association between serum cytokine levels and organ-specific irAEs. (A) Box plots representing serum IL-6 levels (pg/mL) in thyroiditis (n = 9) and non-thyroiditis (n = 42) patients. (B) Box plots representing serum IL-6, IL-22, and SCF levels (pg/mL) in colitis (n = 7) and non-colitis (n = 44) patients. (C) Box plots representing serum IL-1α, IL-21, LIF, and PIGF-1 levels (pg/mL) in myositis (n = 5) and non-myositis (n = 46) patients. (D) Box plots representing serum BTLA, GM-CSF, IL-4, TIM-3, PD-L1, and PD-1 levels (pg/mL) in patients with (n = 3) and without rash (n = 48). The median of each group and P-value were calculated using the Mann-Whitney U test (P < 0.05).

