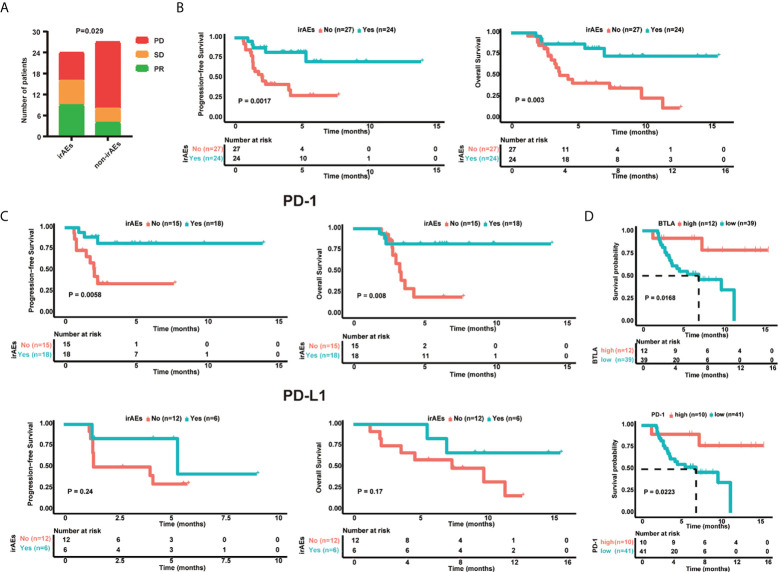
Figure 3.
Baseline serum cytokine levels related to clinical outcomes. (A) Bar Chart showing the response rate in patients with (n = 24) and without irAEs (n = 27). (B) Kaplan-Meier survival curve of PFS and OS in the irAE (n = 24) and non-irAE (n = 27) groups. (C) Kaplan-Meier survival curve of progression-free survival (PFS) and overall survival (OS) following anti-PD-L1 (n = 18) and anti-PD-1 (n = 33) treatment in irAE and non-irAE groups. (D) OS of gastrointestinal cancer patients based on BTLA and PD-1 levels. CR: complete response, PR: partial response, SD: stable disease, PD: progressive disease, PFS: progression-free survival, OS: overall survival. Kaplan-Meier survival curves were plotted for patients using the median cutoff. Statistical significance was determined using the log‐rank (Mantel-Cox) regression analysis, with the level of significance at P ≤ 0.05.

