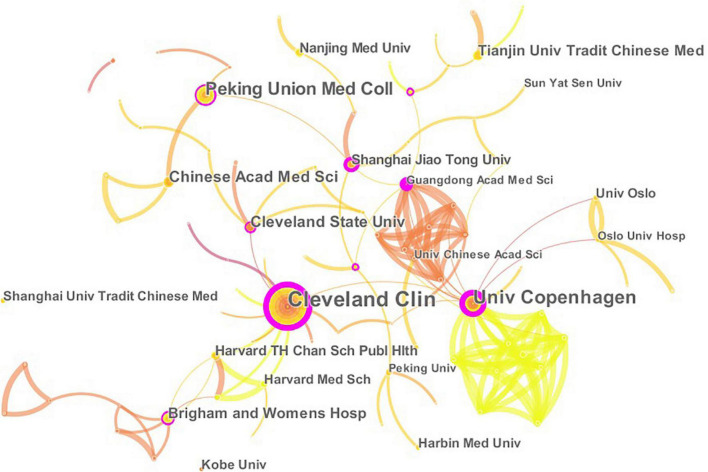
FIGURE 5.
The network of institutions engaged in the research about CHD and gut microbiota. In the networks, the larger the node was, the more contribution the institution had made to that field. The color of the line represents the time of first co-occurrence. The thicker the line is, the greater the connection strength is (calculation method based on cosine).

