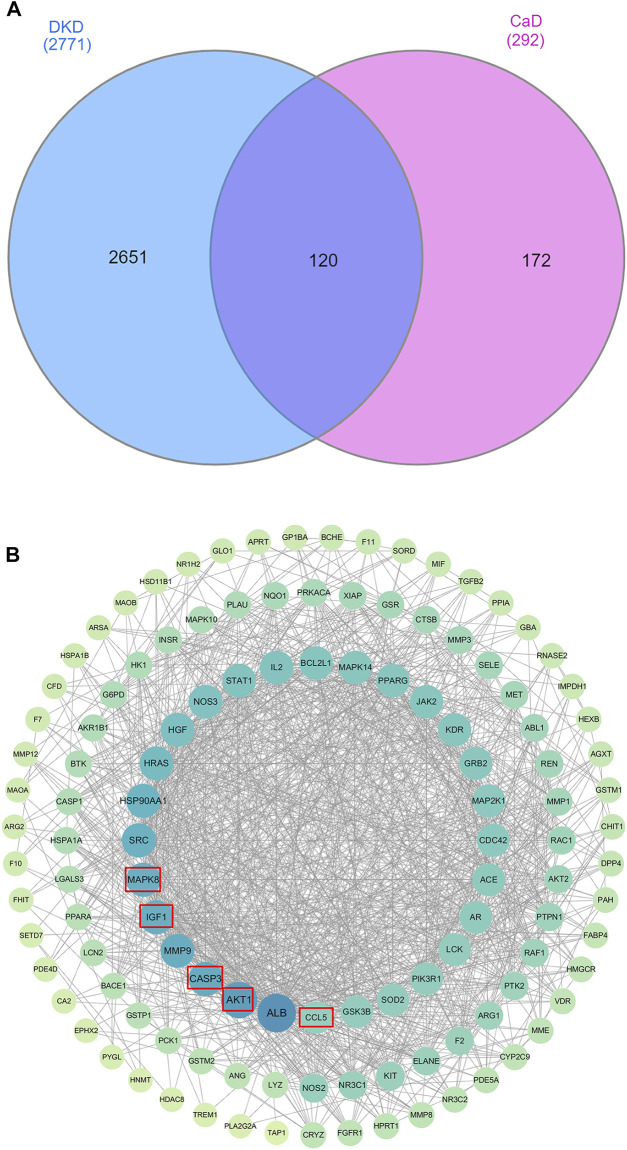
FIGURE 3.
Venn diagram and PPI work. (A) Venn diagram. The blue section indicates DKD-related targets, and the pink section indicates CaD-related targets. Twenty-five targets in the middle overlapping section are common targets of DKD and CaD. (B) PPI network. A total of 119 target proteins and 1,175 interacting edges are present in the network. Sizes and colors of the nodes are illustrated from big to small and blue to green in a descending order of degree values.

