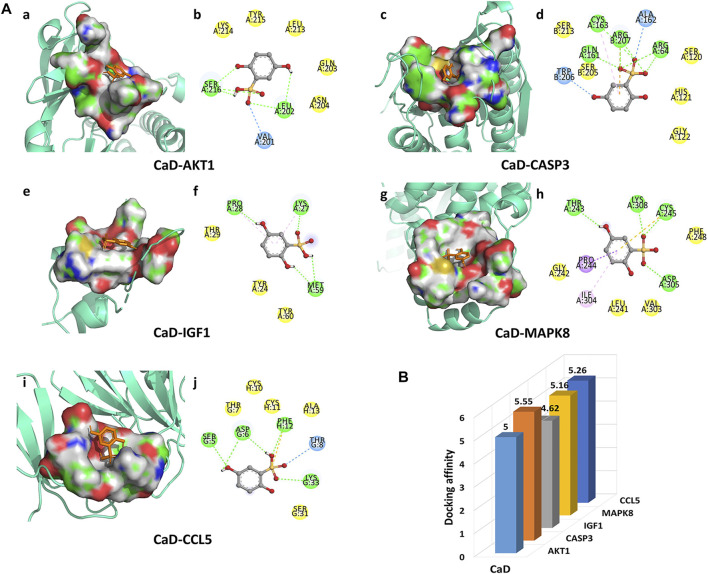
FIGURE 6.
Molecular docking diagram. (A) Five conformations of a molecular docking simulation. Diagrams (3D) represent that the molecular model of the compound is in the binding pocket of the protein. The compound is shown as a stick model in orange. The amino acid residues in the surrounding are represented by surface style. Diagrams (2D) show the interactions between the compound and surrounding residues. (B) 3D column diagram shows the affinity of six conformations. X-axis: bioactive component, y-axis: target names, and z-axis: docking affinity (absolute value of the binding energy).

