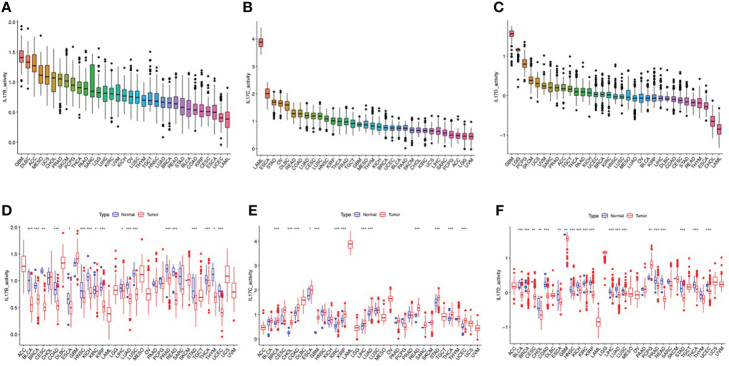
Figure 3.
The different activity analyses based on the TCGA dataset. (A–C) The mean activity of IL-17B, IL-17C, and IL-17D in 33 cancers (from high to low). (D–F) The different activity analysis between tumors and normal groups of IL-17B, IL-17C, and IL-17D in 33 cancers (from high to low). (∗∗∗∗p < 0.0001; ∗∗∗p < 0.001; ∗∗p < 0:01; ∗p < 0.05.).

