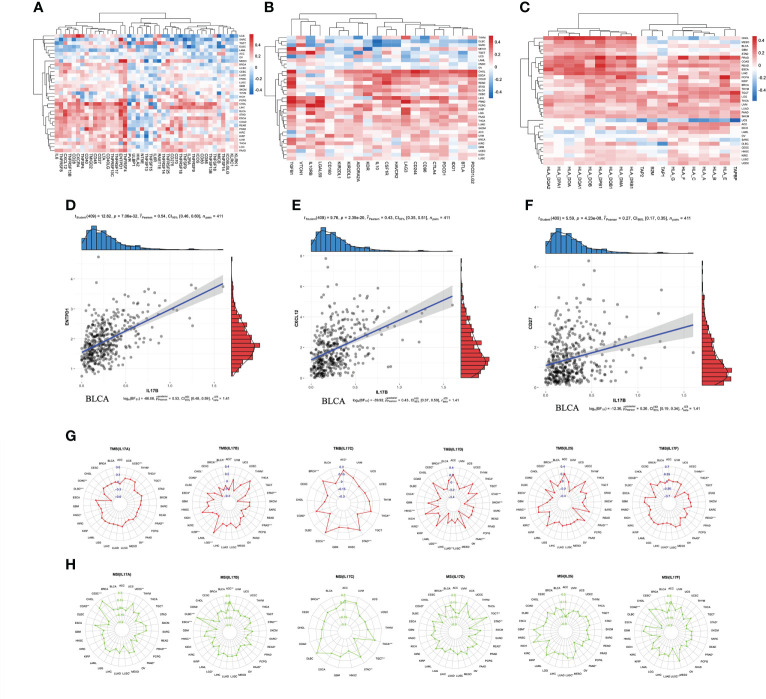
Figure 7.
The correlation between IL-17B expression and immunomodulators including immunostimulators (A), immunoinhibitors (B), and MHC molecules (C). The scatter plots represent the top four strongest correlations in each heatmap (D–F). The correlation between IL-17A–F expression and immunotherapeutic biomarker (TMB and MSI). The red radar charts represent the association between TMB (G) and IL-17A, IL-17B, IL-17C, IL-17D, IL-25, and IL-17F. The green radar charts represent MSI (H) and IL-17A, IL-17B, IL-17C, IL-17D, IL-25, and IL-17F. (∗∗∗p < 0.001; ∗∗p < 0.01; ∗p < 0.05.).

