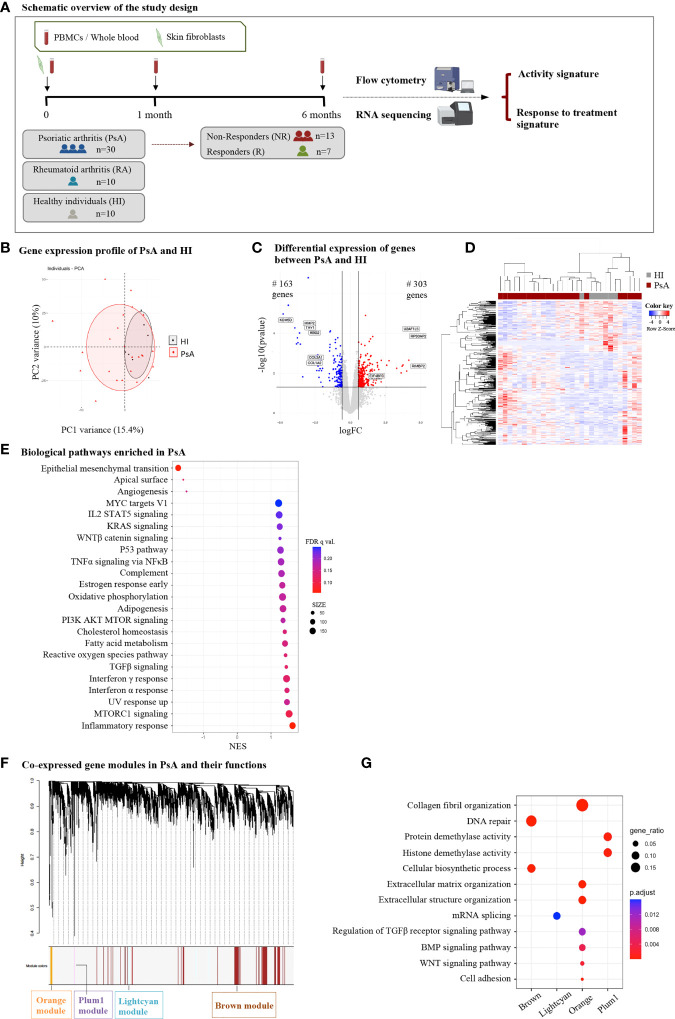
Figure 1.
Subjects with PsA display widespread transcriptome perturbations in peripheral blood compared to healthy individuals. (A) Schematic representation of the study design. Subjects with active PsA were followed up for 6 months after treatment initiation being classified as R or NR. Blood samples were collected at baseline (0-), 1- and 6-month time points. A subset of three PsA patients donated skin biopsy samples for fibroblast isolation. RNA from whole blood and skin fibroblasts was analyzed with RNA sequencing to determine signatures of activity and response to treatment. Flow cytometry analysis of PBMCs was performed in parallel. RA patients and HI were also included in the study. (B) PCA of blood gene expression profiles from PsA patients (n=23) and HI (n=7). The two first principal components (PC1, PC2) are plotted. (C) Volcano plot and (D) heatmap of DEGs between PsA and HI. The up- and down-regulated genes are denoted by red and blue points, respectively. Gray points indicate genes with no significant difference. (E) Dot plot of GSEA analysis representing biological pathways associated with the Hallmark v7.5 database. The figure shows the positively and negatively enriched pathways in PsA. The size of the dots represents the number of genes included in each enriched term. (F) WGCNA analysis of blood gene expression data: Gene dendrogram obtained by average linkage hierarchical clustering and (G) dot plot demonstrating functional annotation of the gene modules. Gene ratio represents the ratio of gene count to term size. PsA, Psoriatic arthritis; R, Responders; NR, Non-responders; PBMCs, Peripheral blood mononuclear cells; RA, Rheumatoid arthritis; HI, healthy individuals; PCA, Principal component analysis; DEGs, differentially expressed genes; GSEA, gene set enrichment analysis; WGCNA, weighted gene co-expression network analysis; FC, fold change; NES, normalized enrichment score.

