Figure 3.
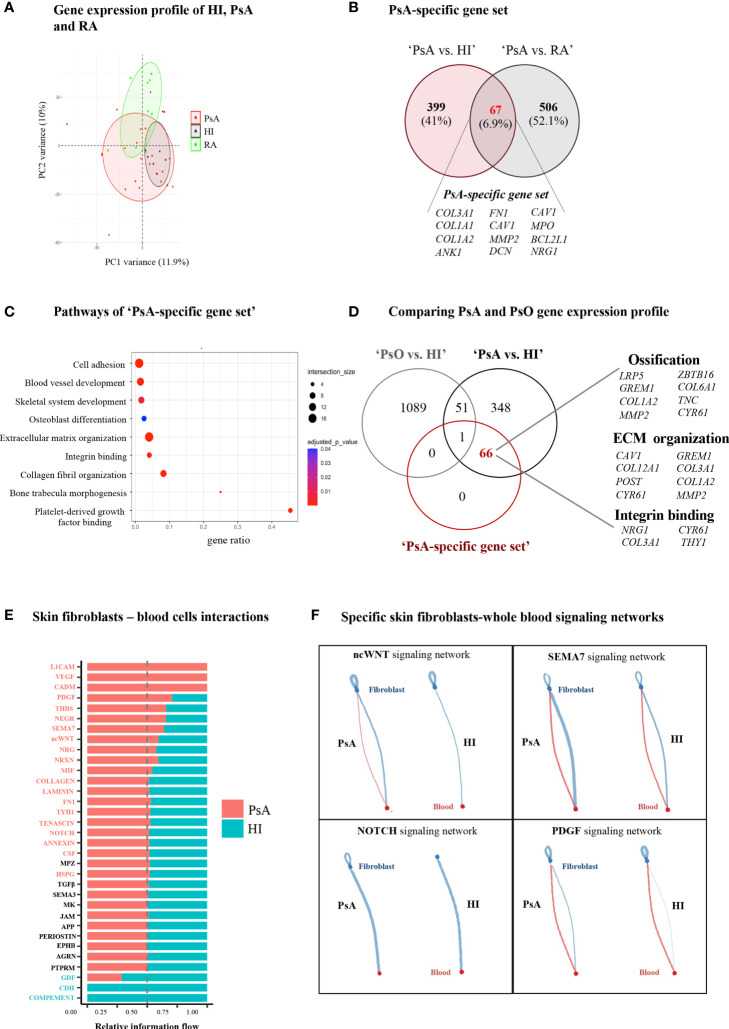
PsA displays a disease-specific signature in blood related to enhanced ECM turnover. (A) PCA of blood gene expression profiles from PsA, RA and HI. The two first principal components (PC1, PC2) are plotted. (B) Venn diagram showing the overlap between ‘PsA vs. HI’ and ‘PsA vs. RA’ DEGs, representing the “PsA-specific gene set”. Selected genes are listed at the bottom of the diagram. (C) Gene ontology analysis, based on g:Profiler, for functional annotation of the “PsA-specific gene set”. (D) Venn diagram showing the overlap among ‘PsA vs. HI’ DEGs, ‘PsO vs. HI’ DEGs and the ‘PsA-specific gene set’. Selected genes related to integrin binding, ECM organization and ossification are depicted. (E) Bar plot illustrating the interaction pathways between blood cells and skin fibroblasts in psoriatic and healthy samples. Significance is inferred based on the relative information flow in each interaction pathway. Red denotes signaling pathways enriched in PsA, blue denotes signaling pathways enriched in healthy state, while pathways depicted in black are equally enriched between the two states. (F) Plots showing selected signaling pathways between blood cells and skin fibroblasts in PsA and HI. Lines originate from a cell type (blood cells or fibroblasts), indicating the source of the ligand, and connect to the cell type (fibroblasts or blood cells, respectively) where the receptors are expressed. The width of each line is proportional to the communication probability, inferred by the number of unique ligand-receptor interactions. Loops represent autocrine circuits. ECM, Extracellular matrix; PsA, Psoriatic arthritis; HI, Healthy individuals; RA, Rheumatoid arthritis; DEGs, Differentially expressed genes; PsO, Psoriasis.

