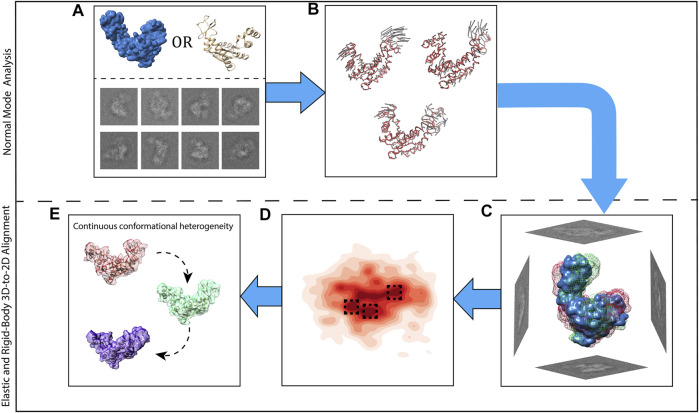
FIGURE 2.
Graphical summary of HEMNMA steps. (A) Input EM map or atomic structure (the reference) and input single particle images. (B) Normal mode analysis of the reference and selection of normal modes (vectors). (C) Elastic and rigid-body alignment of each single particle image with the reference using the selected normal modes. (D) Mapping of single particle images onto a low-dimensional (here, 2D) conformational space in which the reference can be animated (denser regions are marked with a darker red color; close points correspond to images with similar conformations and distant points to images with different conformations). (E) 3D reconstructions from the densest areas in the low-dimensional conformational space shown by squares in (D).

