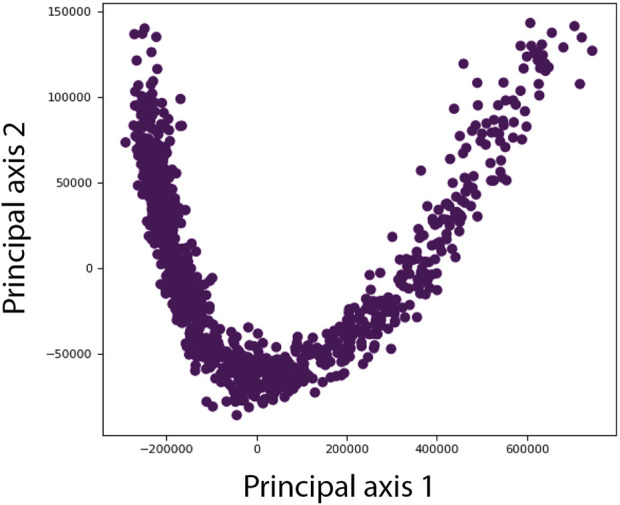
FIGURE 4.

Illustration of a lower-dimensional (here, 2D) conformational space obtained by principal component analysis of the conformational parameters (normal-mode amplitudes) estimated by HEMNMA or predicted by the neural network of DeepHEMNMA. Different points represent different particle images. Each point corresponds to the conformational parameters (normal-mode amplitudes) of the molecular complex in the corresponding sigle-particle image. For each point, the orientation and position of the molecular complex are also available (estimated by HEMNMA or predicted by the neural network) and can be used to calculate 3D reconstructions from interactivelly selected groups of images with similar conformations in the densest regions of this space (not shown in this illustration but in the experiments below).
