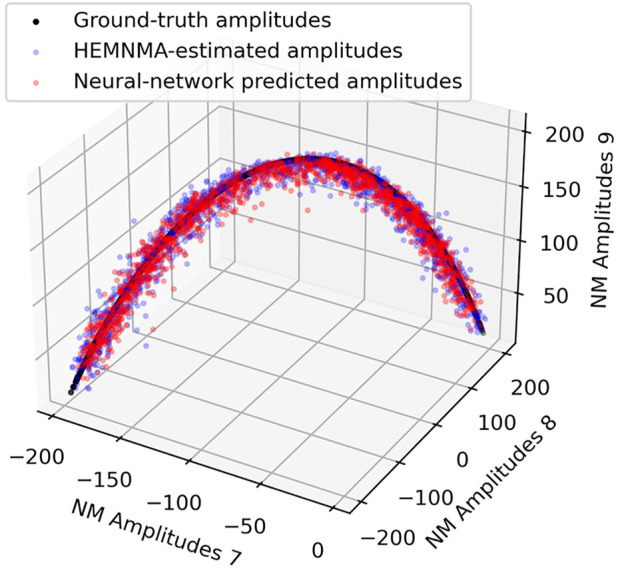
FIGURE 6.

Overlap between inferred, ground-truth, and HEMNMA-estimated values of conformational parameters (normal-mode amplitudes) for a small test set of 2,000 synthetic images. Each point corresponds to an image and a molecular conformation inside it. Close points correspond to similar conformations and vice versa. For 2D scatter plots of the normal-mode amplitudes, see Supplementary Figure S2. See also Tables 1, 2.
