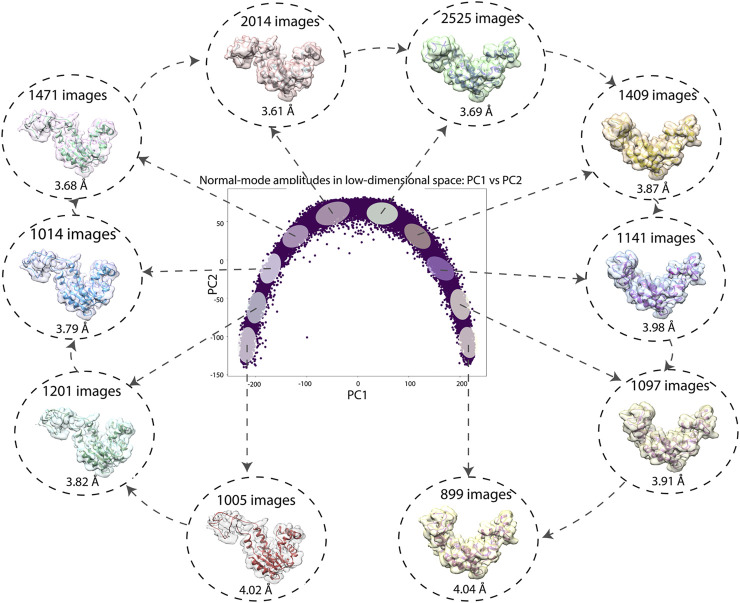
FIGURE 7.
Low-dimensional (here, 2D) conformational space obtained by principal component analysis of the inferred conformational parameters (normal-mode amplitudes) for a large test set of 50,000 synthetic images, together with ten 3D reconstructions from ten different dense regions of this space supperposed with the corresponding atomic models (centroids of the regions). The network training and inference of normal-mode amplitudes, angles, shifts were done using images of size 128 × 128 pixels (for the inferrence accuracy, see Tables 3, 4) and the reconstructions were obtained from images of size 256 × 256 pixels. The number of images used for each reconstruction and the 0.5-FSC resolution of the reconstructed map are also shown (the FSC curves are provided in Supplementary Material SF). Each point in the conformational space corresponds to an image and a molecular conformation inside it. Close points correspond to similar conformations and vice versa.

