FIGURE 8.
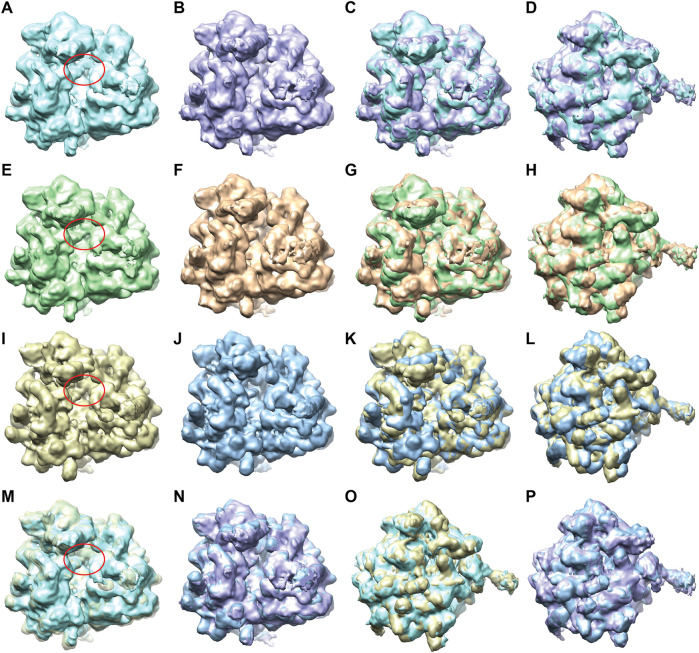
Two average conformations of yeast 80S ribosome-tRNA complexes obtained by 3D reconstruction from EMPIAR-10016 cryo-EM images, with and without additional mass in the region marked with a red ellipse, using DeepHEMNMA and using the original FREALIGN classification parameters from EMPIAR-10016 dataset. (A,B) Same view of two reconstructions obtained from the conformational space based on 12,095 images with inferred parameters (Supplementary Figure S4), from which groups of 4,741 and 4,219 images were used for the reconstructions. (C,D) Two views of the superposed reconstructions from A and B. (E,F) Same view of two reconstructions obtained from the conformational space based on 12,095 images with inferred parameters and 10,000 images with HEMNMA-estimated parameters (Supplementary Figure S5), from which groups of 7,870 and 6,682 images were used for the reconstructions. (G,H) Two views of the superposed reconstructions from E and F. (I,J) Same view of two reconstructions obtained using FREALIGN parameters for 22,369 and 23,726 images resulting in EMD-5977 and EMD-5976 maps, respectively. (K,L) Two views of the superposed reconstructions from I and J. (M,N) Superposition of the reconstructions obtained from images with inferred parameters and those obtained using FREALIGN parameters (M: overlap between the reconstructions shown in A and I; N: overlap between the reconstructions shown in B and J). (O,P) Different view of the superposed volumes shown in M-N, respectively. The red ellipse shown in panels A, E, I, M indicates the region with the additional mass (corresponding to the additional tRNA), with respect to the same region in panels B, F, J, N, respectively. All surfaces are shown in solid color except for the yellow surface in M that is shown transparent for a better visualization of the additional mass (red ellipse).

