FIGURE 9.
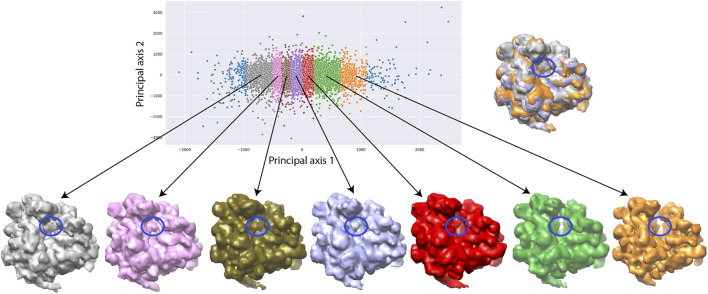
Two-dimensional conformational space of yeast 80S ribosome-tRNA complexes from the EMPIAR-10016 cryo-EM images, obtained by principal component analysis of normal-mode amplitudes inferred from 12,095 images (top, left), with 7 average conformations obtained by 3D reconstruction (bottom) from groups of images selected along the first principal axis, and an overlap of the maps reconstructed from the first (gray), fourth (violet), and seventh (orange) groups (top, right). The far left and far right images (blue) were not used for the reconstructions and the remaining part of the conformational space was split quasi-uniformly in the way to get at least 900 images per group. The reconstructions were obtained from 1,018, 1,148, 1,461, 1,816, 1,771, 975, and 949 images (bottom, from left to right). The color of the reconstructed map (bottom) corresponds to the color of the group of points in the conformational space (top). The blue ellipse overlapped with the reconstructed maps indicates the region where the additional mass, corresponding to the additional tRNA, is present or absent.

